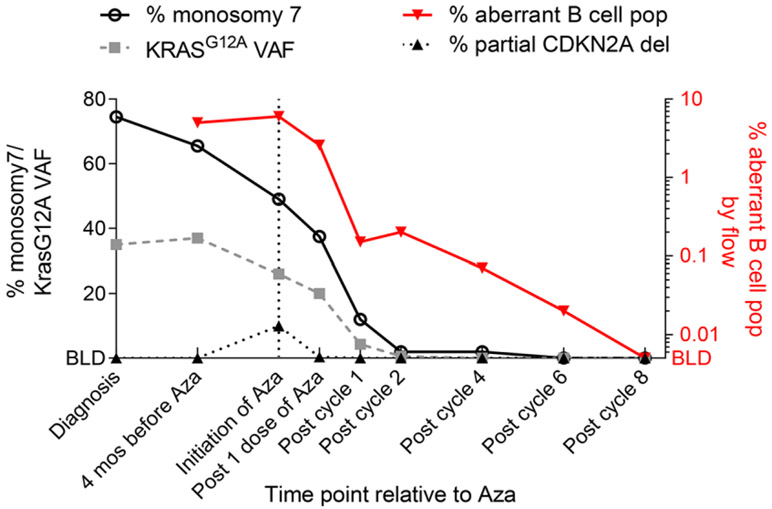
FIGURE 2.
Trend of molecular and cytogenetic abnormalities; the left Y-axis represents the percentage of monosomy 7 and CDKN2A deletion by fluorescent in situ hybridization, and KRAS G12A variant allele fraction (VAF) by next-generation sequencing in bone marrow aspirates; the right Y-axis represents the percentage of aberrant B-cell lymphoblasts by flow cytometry; the X-axis denotes the time points during azacitidine (Aza) therapy at which that the molecular and cytogenetic data were obtained; BLD, below limit of detection

