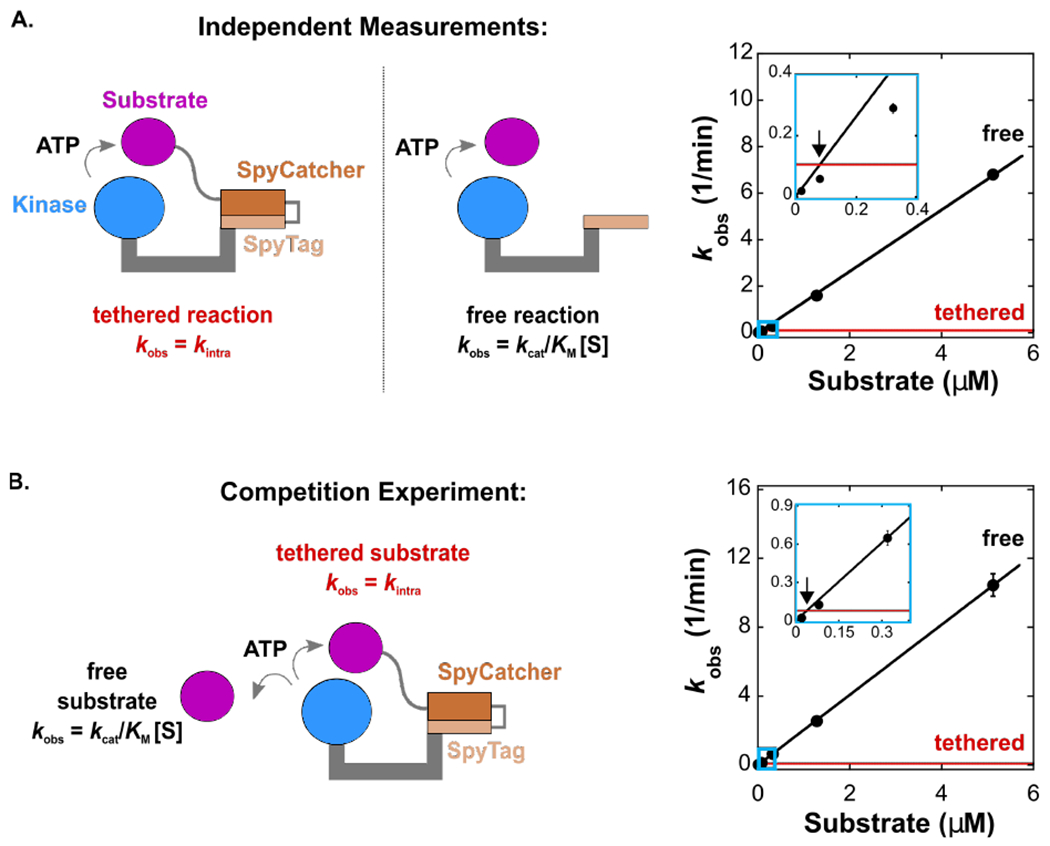
Figure 3. Intermolecular reactions readily outcompete the covalently tethered reaction.

(A)Schematic of the tethered (4 aa linker) and free reaction and corresponding plot of kobs vs. [substrate] for the tethered (red) and free (black) reactions. Inset is marked with light blue rectangle. The observed effective molarity is 0.08 μM.
(B) Schematic of a competitive reaction with both tethered (4 aa linker) and free substrates present, and corresponding plot of kobs vs. [substrate] for the tethered (red) and free (black) reactions. Inset is marked with light blue rectangle. The observed effective molarity is 0.04 μM.
Each [product] vs time trace was measured from separate reactions in duplicate. For (A) and (B), error bars represent the standard error for kobs obtained from a linear fit to [product] vs time for both datasets. The error for kintra is smaller than the thickness of the red line (see Table 2).
