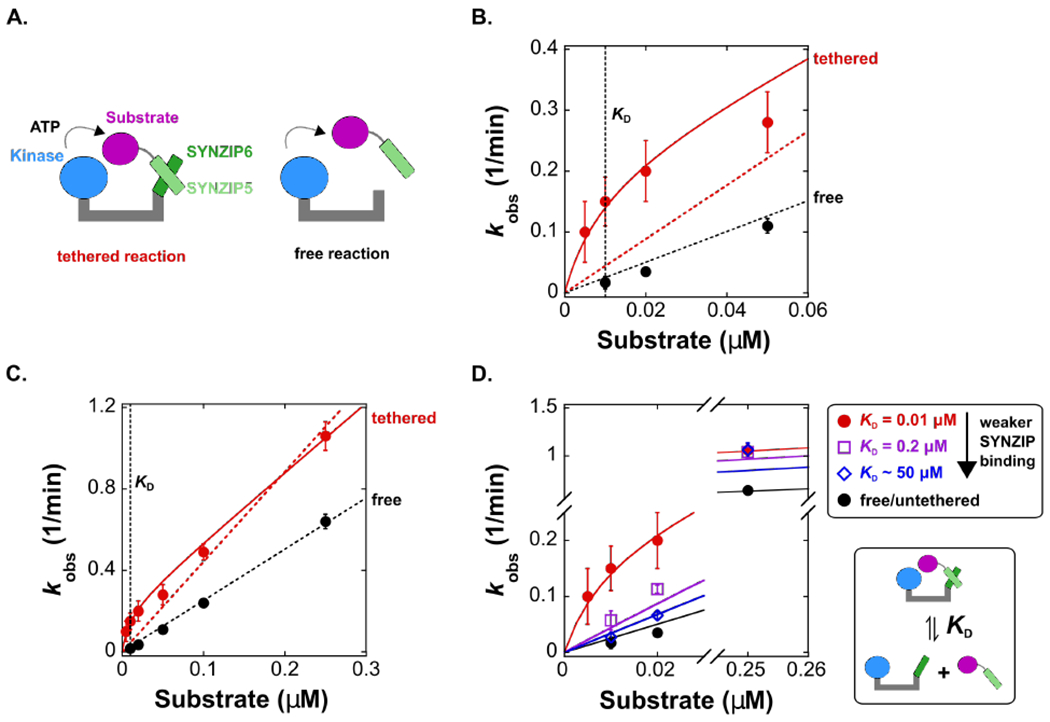
Figure 5. Non-covalent tethering enhances the rate of phosphorylation and depends on the relationship between effective molarity and KD.

(A) Schematic of a model scaffold with a non-covalent tether that recruits a substrate to a kinase. The kinase is fused to SYNZIP6 (PKA-SYNZIP6) and the substrate is fused to SYNZIP5, which interact to form the tethered complex. In the corresponding free reaction, we used a kinase without SYNZIP6.
(B) Plot of kobs vs. [substrate] for the tethered and free reactions for [substrate] < 0.06 μM. At concentrations below the effective molarity, the values of kobs for the tethered reaction are significantly larger than the untethered reaction. The solid red line is a fit to a kinetic model (Scheme 1 and Supporting Information) that includes a contribution from kintra, which accurately fits the tethered reaction data. The dotted lines are fits to a model where kobs = (kcat/KM)[S] (this linear fit forces the line through zero). Both fits include data at higher substrate concentrations (full dataset is shown in panel C), and for the tethered reaction this linear model fails to account for the observed rate increase at low substrate concentrations. For the untethered reaction, the data scale linearly with [substrate]. The reaction of PKA-SYNZIP6 is also first order in enzyme concentration (Figure S6).
(C) Plot of kobs vs. [substrate] over an expanded range of substrate concentrations up to 0.25 μM. The dotted lines are fits to a simple linear model (kobs = kcat/KM [S]), and the solid red line is a fit to the complete model that includes kintra (Scheme 1 and Supporting Information). For the untethered reaction, the slope corresponds to a bimolecular rate constant (kcat/KM) of 4.2 × 10⁴ M−1 s−1. For the tethered reaction, the value of kcat/KM obtained from the fit to the complete model (solid red line) is 5.6 × 10⁴ M−1 s−1. This value differs from the untethered reaction by a factor of 1.3, likely due to prep-to-prep variations in the total activity of PKA-SYNZIP6 versus free PKA.
(D) Plot of kobs vs. [substrate] for the tethered reaction with the SYNZIP 5/6 pair and with two SYNZIP5 truncations that weaken the binding affinity (increasing KD) (Figure S19). At [substrate] < 0.03 μM, values of kobs decrease as KD increases. At [substrate] = 0.25 μM, well above the effective molarity, values of kobs are indistinguishable for substrates with different SYNZIP interaction affinities. The solid lines represent kinetic models using the values of kintra and kcat/KM from the untruncated pair in Figure 5C, and the corresponding KD value from each truncated pair. For SYNZIP5trunc2, we used a KD of 50 μM (using larger KD values does not change the prediction, see Figure S18B & C). Each [product] vs time trace was measured from separate reactions in duplicate. Error bars in B-D represent the standard error for kobs obtained from a linear fit to [product] vs time for both datasets.
