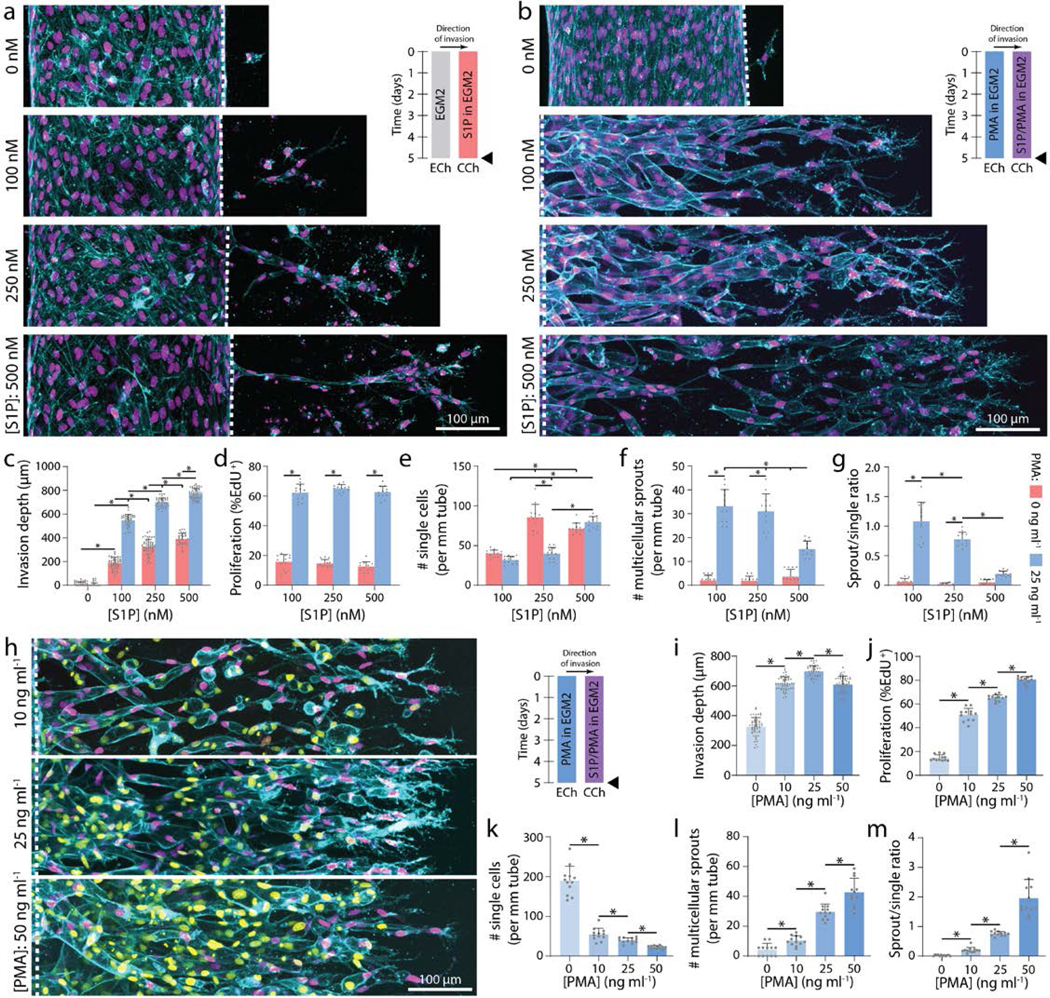
Figure 2 |. Soluble factors modulate EC invasion, proliferation, and multicellular sprouting.

a, Representative images (max intensity projection) of invading endothelial cells in response to varying [S1P]. b, Representative images (max intensity projection) of invading endothelial cells in response to varying [S1P] with 25 ng ml−1 PMA. F-actin (cyan), nucleus (magenta), and dashed white lines indicate parent vessel edge (a-b). c-g, Quantifications of invasion depth, proliferation, and morphology of invading endothelial cells as single cells or multicellular sprouts. h, Representative images (max intensity projection) of invading endothelial cells in response to varying [PMA] with 250 nM S1P. i-m, Quantifications of invasion depth, proliferation, and morphology of invading endothelial cells as single cells or multicellular sprouts. UEA (cyan), nucleus (magenta), EdU (yellow). All data presented as mean ± s.d.; * indicates a statically significant comparison with P<0.05 (one-way analysis of variance). For invasion depth analysis (c, i), n≥32 vessel segments (each 100 μm length) per condition; for proliferation and migration mode analysis (d-g, j-m), n=12 vessel segments (each 800 μm length) per condition from n=2 devices/condition (technical replicates) over n≥4 independent studies (biological replicates).
