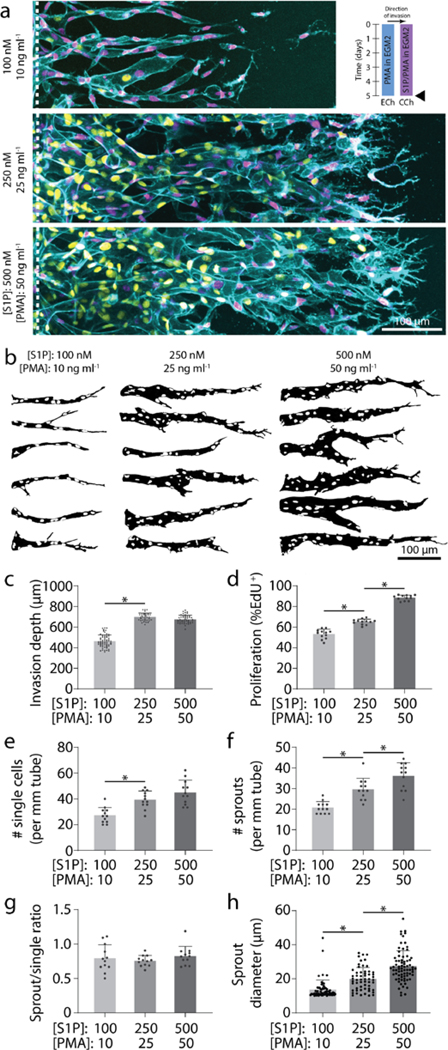
Figure 3 |. Multicellular sprouting requires balanced migration and proliferation.

a, Representative images (max intensity projection) of invading endothelial cells in response to proportional variations of [S1P] and [PMA]. UEA (cyan), nucleus (magenta), EdU (yellow). b, Representative sprout outlines from conditions in (a). c-h, Quantifications of invasion depth, proliferation, morphology of invading endothelial cells as single cells or multicellular sprouts, and sprout diameter. All data presented as mean ± s.d.; * indicates a statically significant comparison with P<0.05 (one-way analysis of variance). For invasion depth analysis (c), n≥36 vessel segments (each 100 μm length) per condition. For proliferation and migration mode analysis (d-g), n=12 vessel segments (each 800 μm length) per condition from n=2 devices/condition (technical replicates) over n≥4 independent studies (biological replicates). For sprout diameter analysis (h), n≥56 sprout segments.
