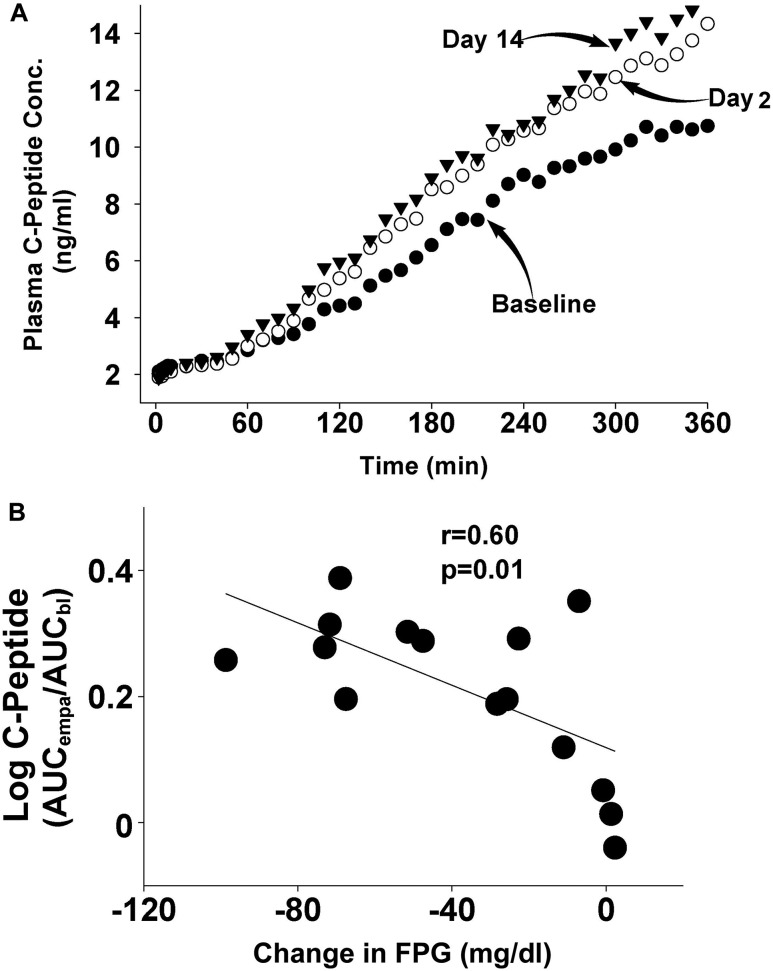
Figure 2.
(A) Plasma C-peptide response during the stepped hyperglycemic clamp performed at baseline and on days 2 and 14 after the start of empagliflozin therapy. (B) Correlation between the decrease in the FPG concentration and the log of the ratio of the plasma C-peptide response after 14 days of empagliflozin to the plasma C-peptide response at baseline. AUCbl, plasma C-peptide response at baseline; AUCempa, area under the curve after 14 days of empagliflozin; Conc, concentration.

