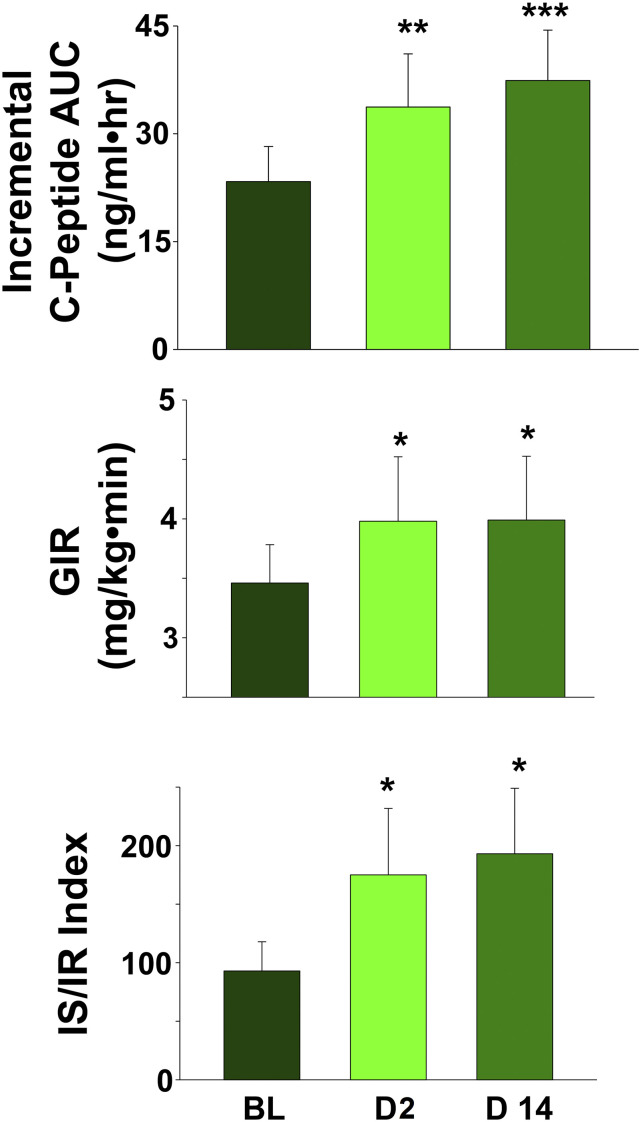
Figure 3.
(A) Incremental AUC for the plasma C-peptide response at baseline and on days 2 and day 14 after the start of empagliflozin treatment. (B) GIR at baseline and on days 2 and 14 after the start of empagliflozin. (C) The IS/IR index at baseline and on days 2 and 14 after the start of empagliflozin treatment. *P < 0.05. AUC, area under the curve; BL, baseline; D2, day 2; D14, day 14; GIR, glucose infusion rate.

