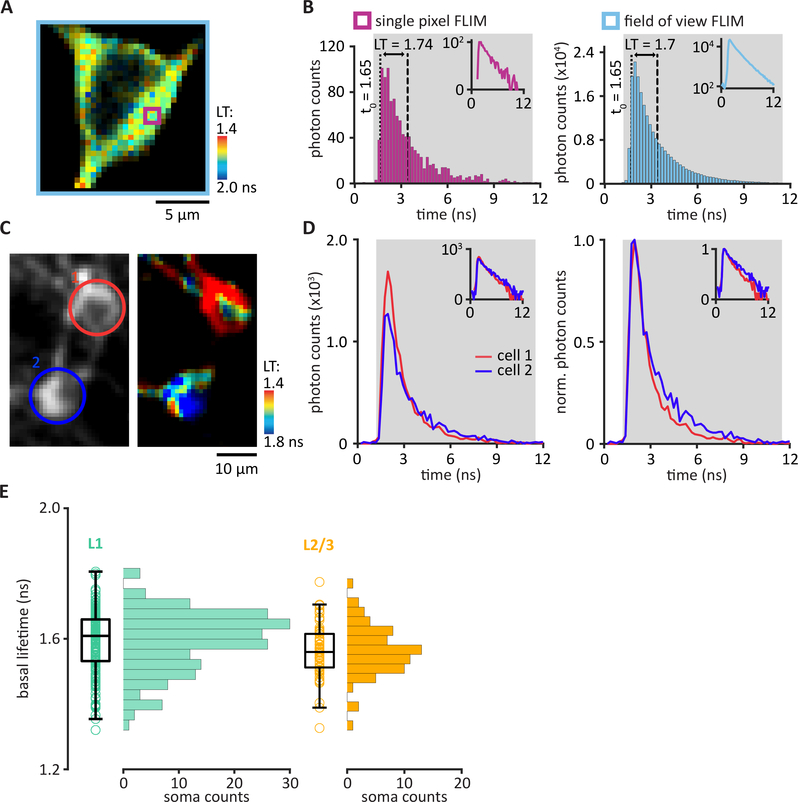
Figure 3: The quantification of 2pFLIM data.
(A) A FLIM image with each pixel pseudo-colored to represent the mean lifetime (LT), relative to the laser timing, of all photons in that pixel. (B) The photon arrival times within a single pixel (purple square in panel A) were plotted in a histogram (left panel). Integration boundaries were set to determine the single photon counting range (SPC, gray). Within the SPC range, the integral of photon timing was divided by the total number of photons and then subtracted by the t0 (1.65 ns, dashed line), resulting in a mean lifetime (LT, distance between dashed and dotted lines) of 1.74 ns. Quantification of the mean lifetime of the entire field of view (light blue square in panel A) involved the integration of photon timing collected in all pixels (right panel), resulting in a mean lifetime of 1.7 ns. Insets show the same data in semi-log scale. (C and D) Quantification of mean lifetime per region of interest (ROI). (C) Representative example of a 2pFLIM image. Two ROIs were drawn around two somata in layer 2/3 of the motor cortex. (D) Photon timing distributions integrated across all pixels within each ROI (left panel). Cell ROIs were color-coded (as shown in panel C) red, cell 1; blue, cell 2. Normalized photon counts allow for comparison of photon timing distributions between the two ROIs (right panel, mean lifetime; cell 1, 1.33 ns; cell 2, 1.73 ns). Insets show the same data in semi-log scale. (E) Distribution plot of mean basal lifetimes from 254 imaged cells in the superficial layers of the motor cortex. L1 cells (n = 186 cells/11 animals, left panel), residing within 100 μm below pia, expressed tAKARα after a stereotaxic injection of AAV2/1-hSyn-tAKARα-WPRE, and L2/3 pyramidal cells (n = 68 cells/4 animals, right panel), residing at least 150 μm below pia, expressed tAKARα after IUE of a CAG-tAKARα-WPRE DNA construct.

