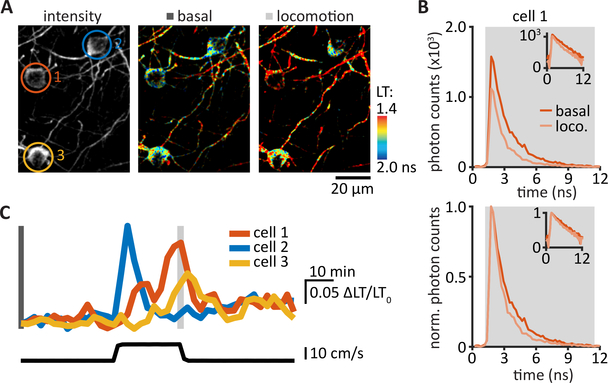
Figure 4: tAKARα tracks enforced locomotion-induced PKA activities in the motor cortex.
(A) Representative intensity (left panel) and lifetime (middle and right panels) images of three L1 cells in the motor cortex. Cell ROIs were color-coded: orange, cell 1; blue, cell 2; yellow, cell 3. (B) Photon timing distributions measured in cell 1 (upper panel) during the basal condition (orange trace, as measured in middle panel Α) and enforced locomotion (loco., light orange trace, as measured in right panel A). Normalized photon counts allowed for direct comparison of photon timing distribution (lower panel, mean lifetime: basal, 1.72 ns; locomotion, 1.42 ns). Insets show the same data in semi-log scale. (C) Δlifetime/ lifetime0 (ΔLT/LT0) traces of the corresponding cells (upper panel, see panel A) with enforced locomotion speed (lower panel).

