
Extended Data Fig. 4. Number of well replicates passing QC in the PRISM screens.
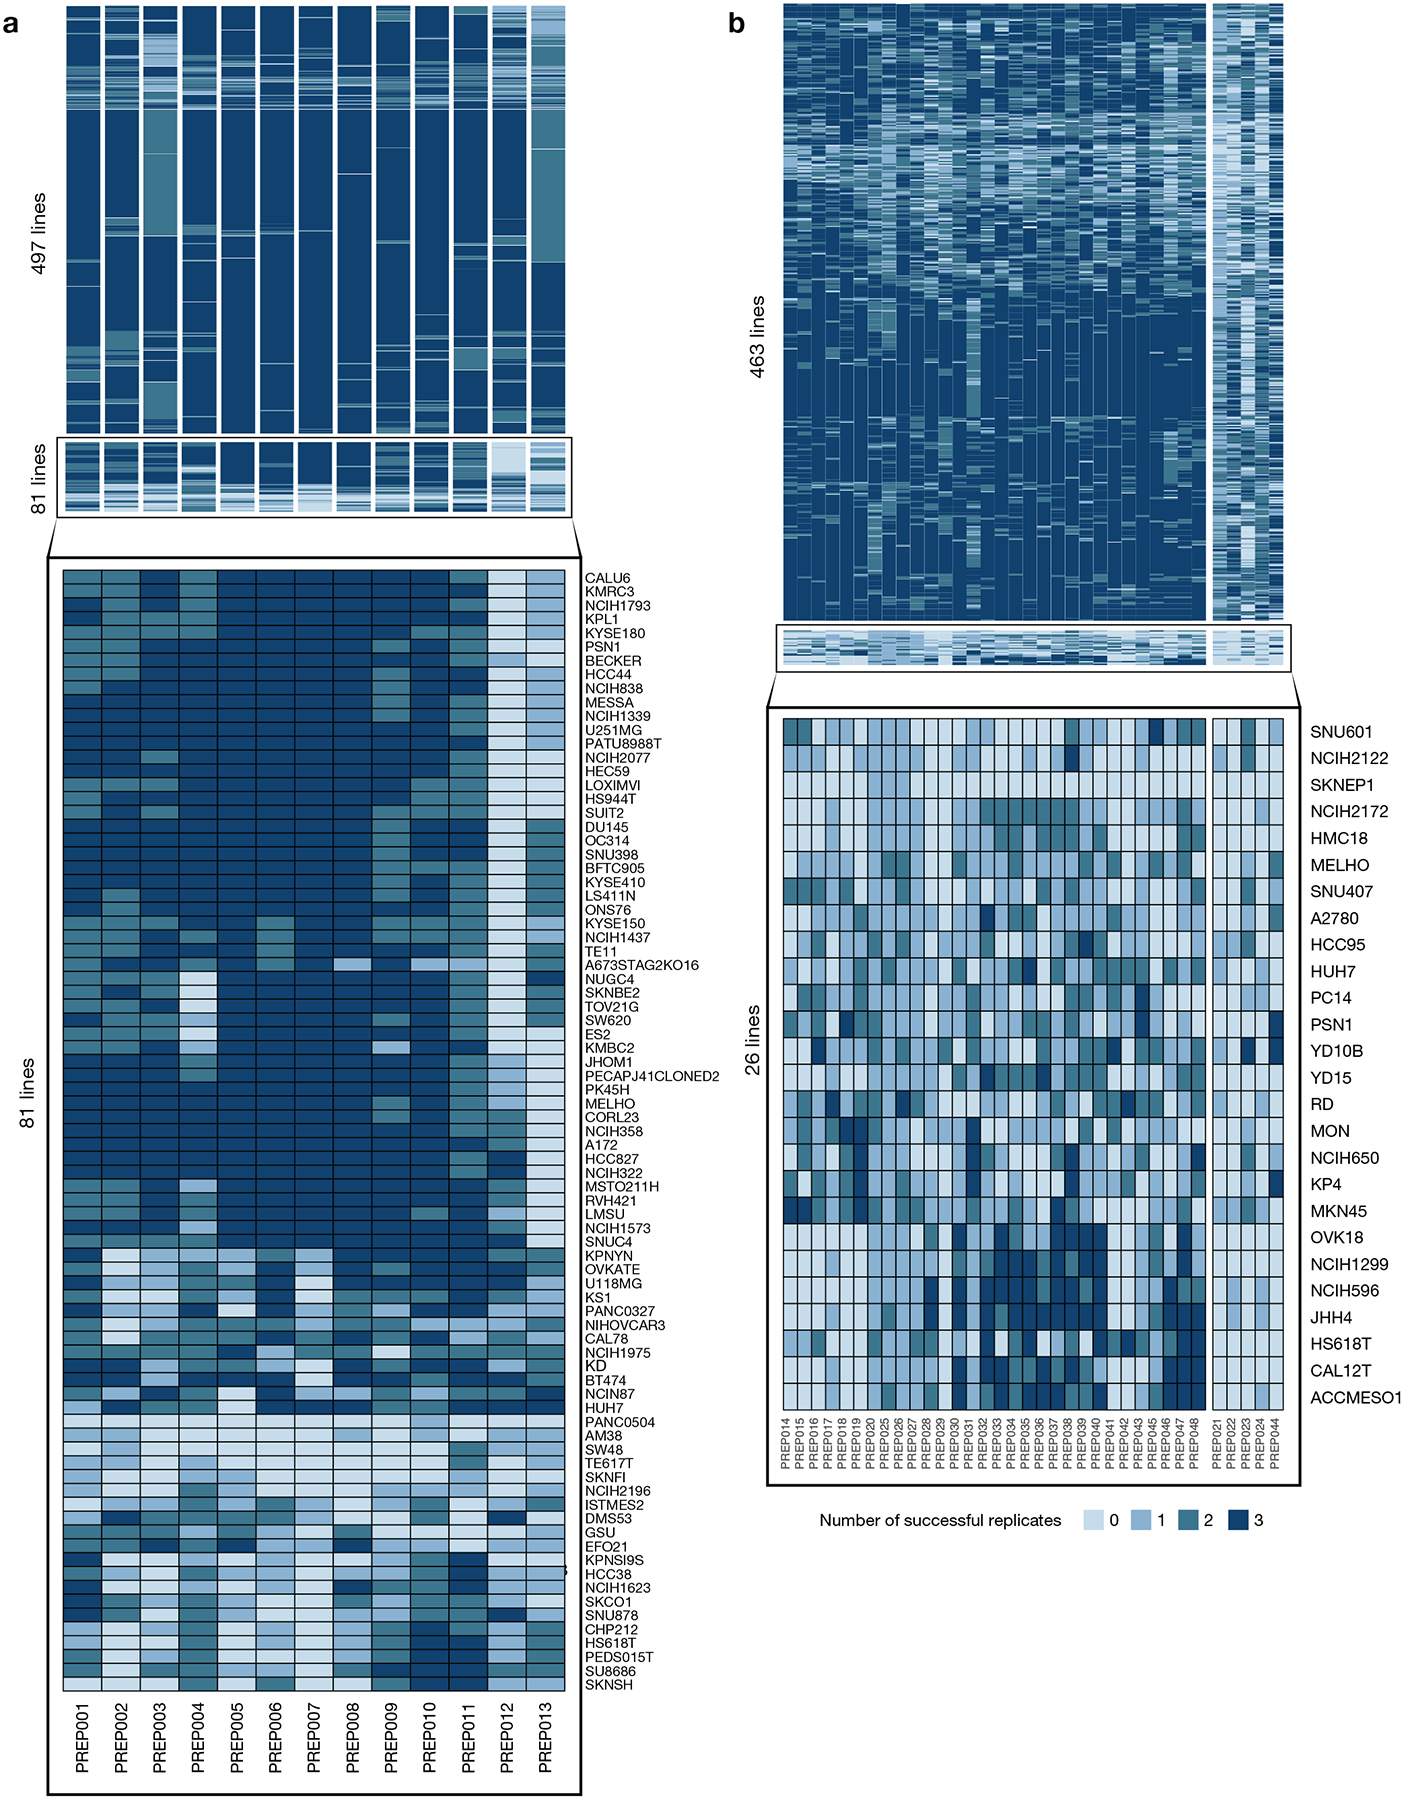
a, Number of individual cell assay well replicates (max n = 3) that pass QC filters in the primary screen, grouped by compound plate and cell line quality. 86% (497 out of 578) of the cell lines have at least one passing replicate for all compound plates. Identity of cell lines with lower quality data are listed at the bottom. b, Number of individual cell assay well replicates (max n = 3) that pass QC filters in the secondary screen. 95% (463 out of 489) of cell lines have at least 1 passing replicate on at least 85% (30 out of 35) of the compound plates.