
Extended Data Fig. 6. PRISM Repurposing noise quantification.
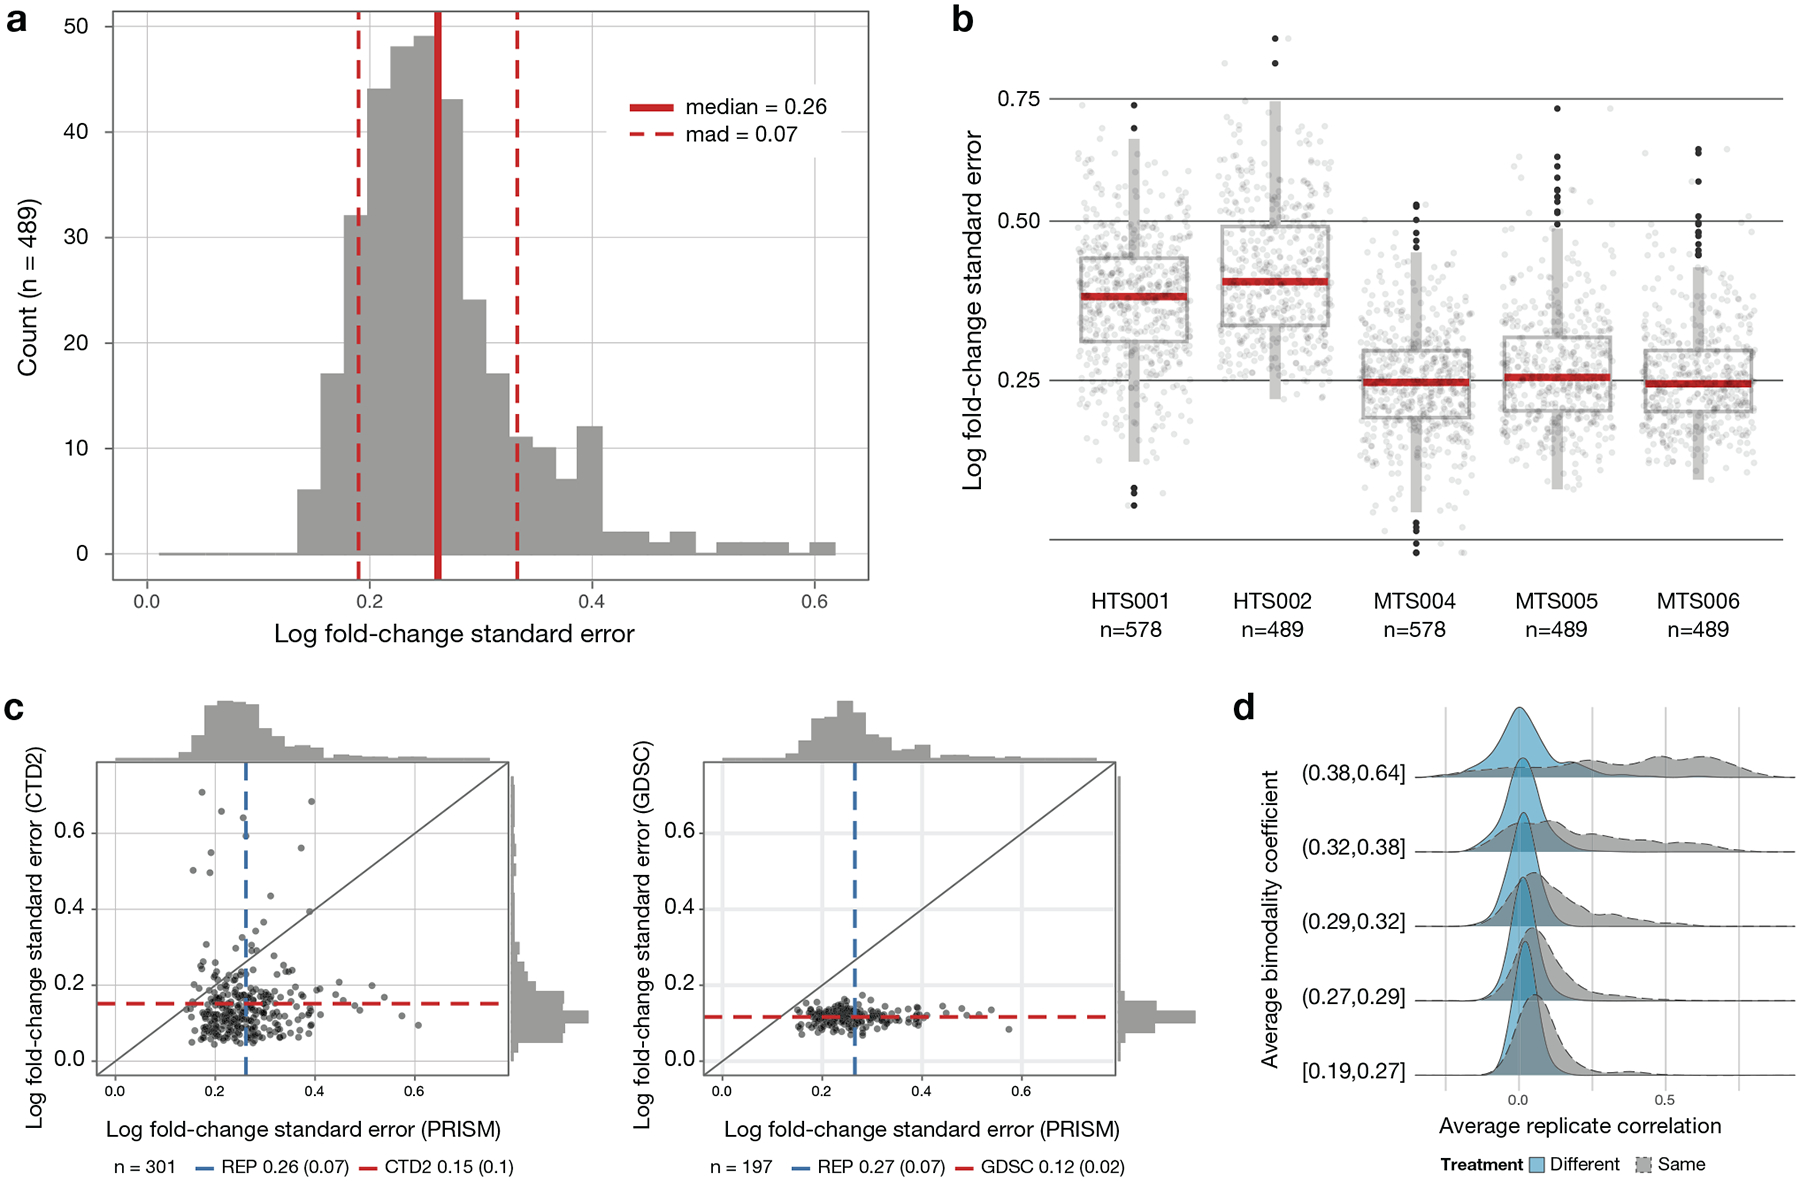
a, Cell line standard error estimates across vehicle-treated wells on PRISM plates treated with DMSO (n = 489 cell lines). Log fold-change standard errors are estimated for each cell line using DMSO-only plates included in the MTS006 screen (n = 384 × 3 replicate wells for each cell line). b, Comparison of standard error estimates across screens. The error estimate calculation is repeated for each screen using DMSO wells on standard compound plates (n = 32 replicate wells per plate), except for MTS006, which uses DMSO-only plates (n = 384 replicate wells per plate). Higher noise levels are observed in the initial high-throughput screens HTS001 (n = 578 cell lines) and HTS002 (n = 489 cell lines) compared with the medium-throughput screens MTS004 (n = 578 cell lines), MTS005 (n = 489 cell lines), and MTS006 (n = 489 cell lines). Upper box limits, center lines, and lower box limits correspond to 75th, 50th, and 25th percentiles, respectively. Whiskers extend from the box limits to the most extreme value up to 1.5 IQR from the median. All cell lines are depicted as points, regardless of outlier status. c, Comparison of estimated standard error of vehicle control wells between high-throughput pharmacogenomic datasets. The average standard error across cell lines (n = 301 cell lines for PRISM versus CTD2 and n = 197 for PRISM versus GDSC) is indicated by dashed lines with standard deviation in parentheses. d, Relationship between drug selectivity and replicate reproducibility in PRISM. Average Pearson correlation between replicates for each compound, dose, and screen combination is stratified by mean bimodality coefficient. For comparison, the null distribution for randomly paired compounds is shown in blue.