
Extended Data Fig. 7. Generation of knockout cell lines by CRISPR/Cas9 editing.
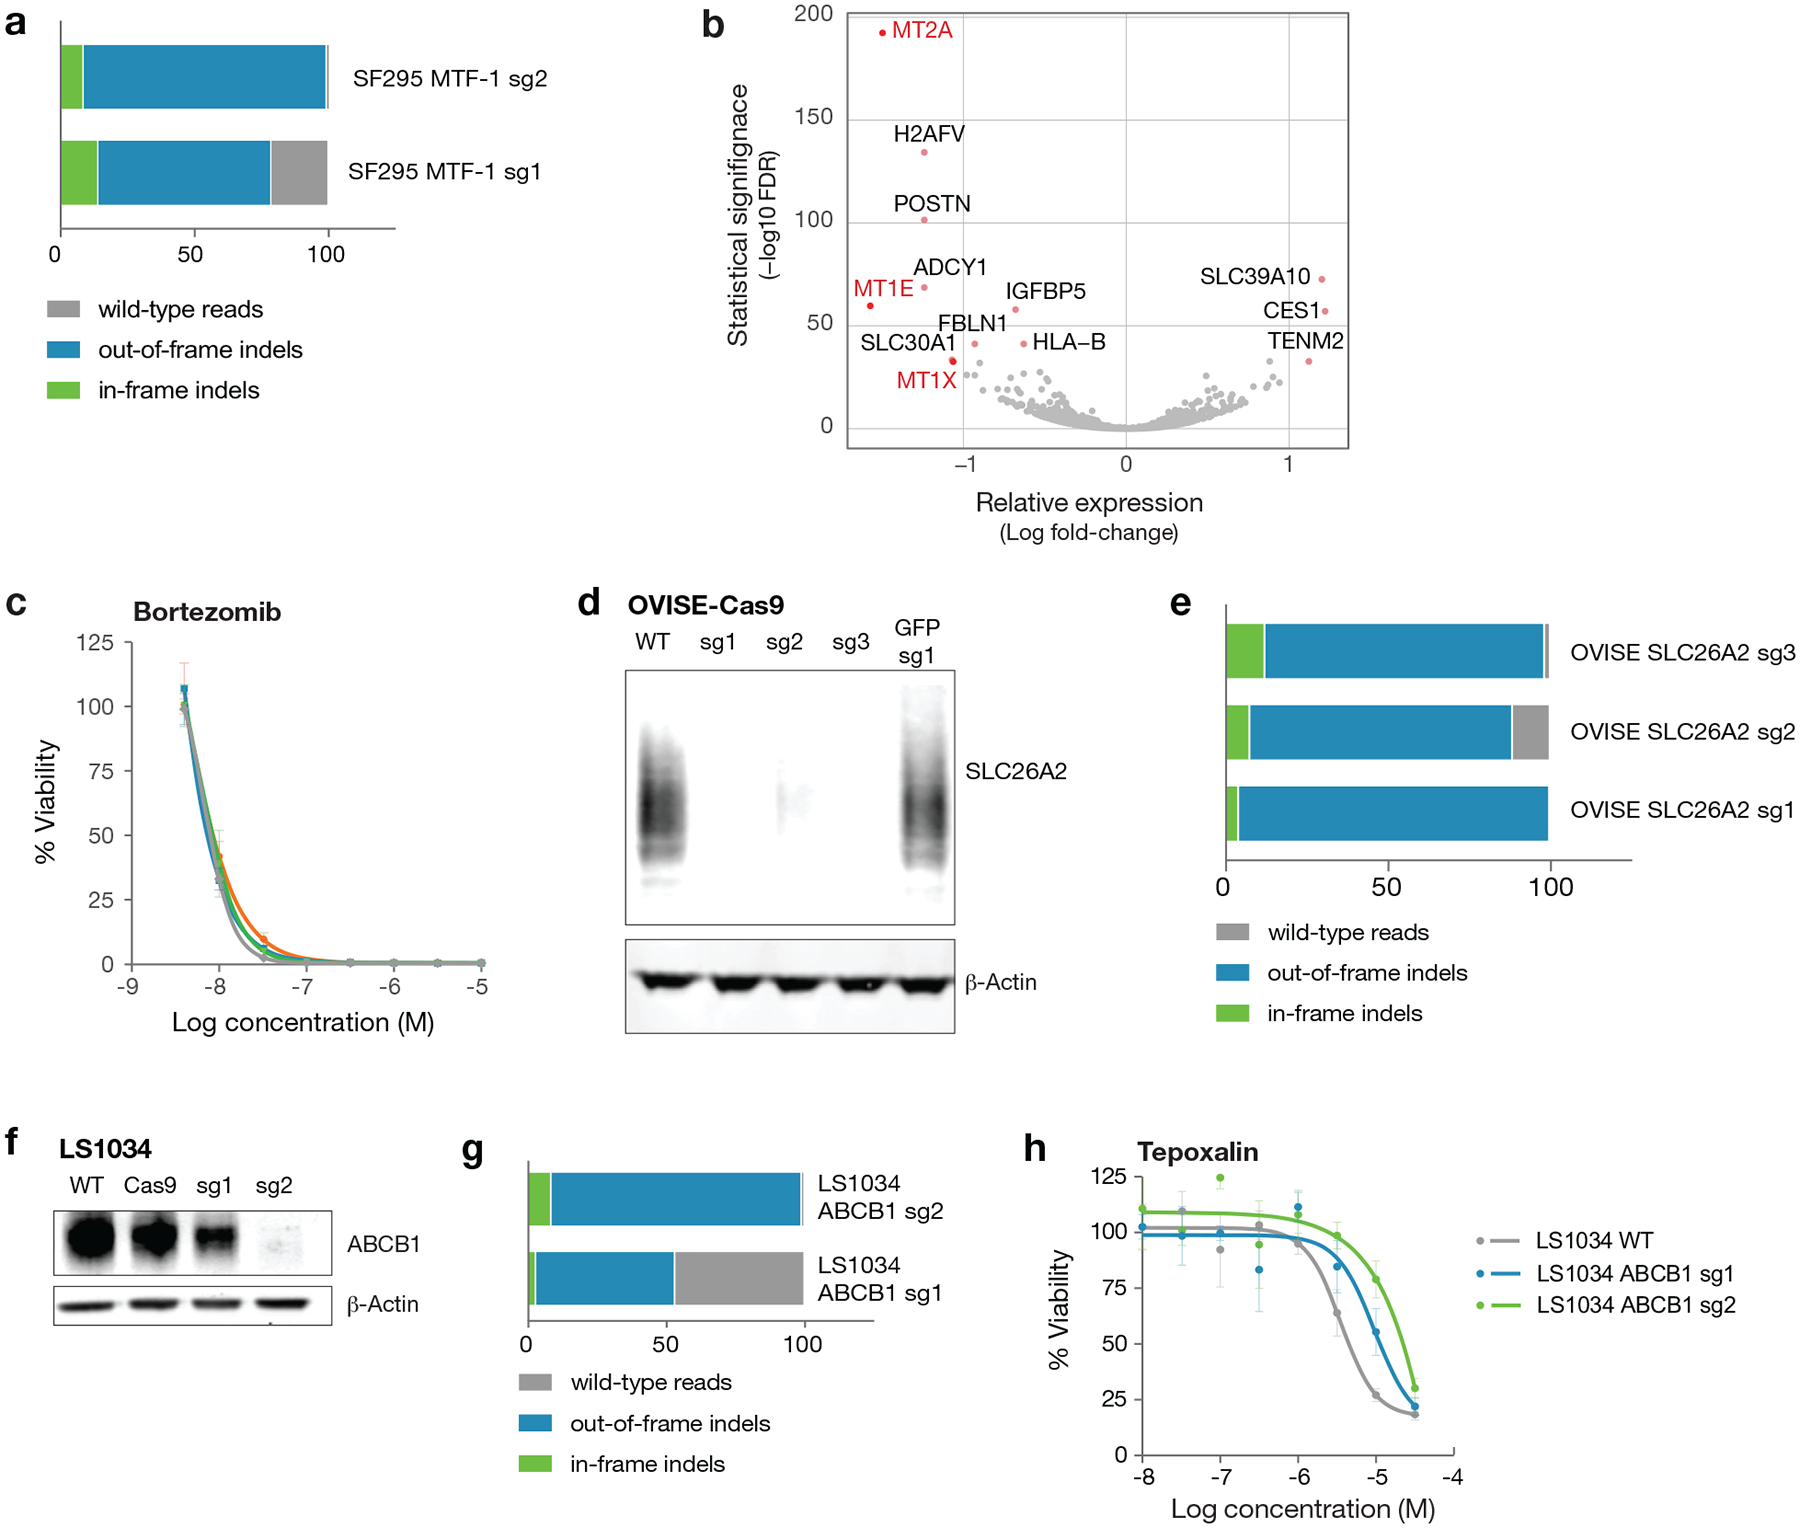
a, SF295 cells were transduced with multiple guides targeting the MTF-1 gene. Following selection, genomic DNA was isolated, and the targeted region was amplified by PCR. Results from the NGS CRISPR assay are shown as percent indel formation. b, Differentially expressed genes in SF295 glioma cells following MTF-1 knockout by CRISPR/Cas9. Loss of MT1E, MT1X, and MT2A expression was observed upon MTF-1 knockout. Gene expression across three independent cell wells per cell line were measured by mRNA sequencing. Two-sided p-values for differential gene expression following MTF-1 knockout vs. parental cell line were calculated with DESeq2 and corrected for multiple hypothesis testing using the Benjamini-Hochberg method. c, Drug sensitivity of SF295 cells with and without MTF-1 knockout. MTF-1 does not alter sensitivity to control chemotherapeutic bortezomib. Mean viability across 3 independently treated wells is shown, with standard deviation indicated by error bars. d, Western immunoblot validation of SLC26A2 knockout in OVISE ovarian and A2058 melanoma cancer cell lines. The SLC26A2 protein is known to migrate across a range of molecular weights due to glycosylation. Results are representative of two independent experiments. e, OVISE cells were transduced with multiple guides targeting the SLC26A2 gene. Indel frequency at the SLC26A2 CRISPR Cas9 cut sites was assessed by NGS CRISPR assay. f, ABCB1 western blot with and without CRISPR knockout of ABCB1 in the LS1034 colon cancer cell line. Western blot was performed once. g, Percent indel formation at genomic cut site in LS1034 ABCB1 CRISPR knockout lines assessed by NGS CRISPR assay. h, Cellular viability of LS1034 CRISPR knockout lines after treatment with tepoxalin for 5 days. Mean viability across 3 independently treated wells is shown, with standard deviation indicated by error bars.