
Fig 2. Drug response landscape of human cancer cell lines.
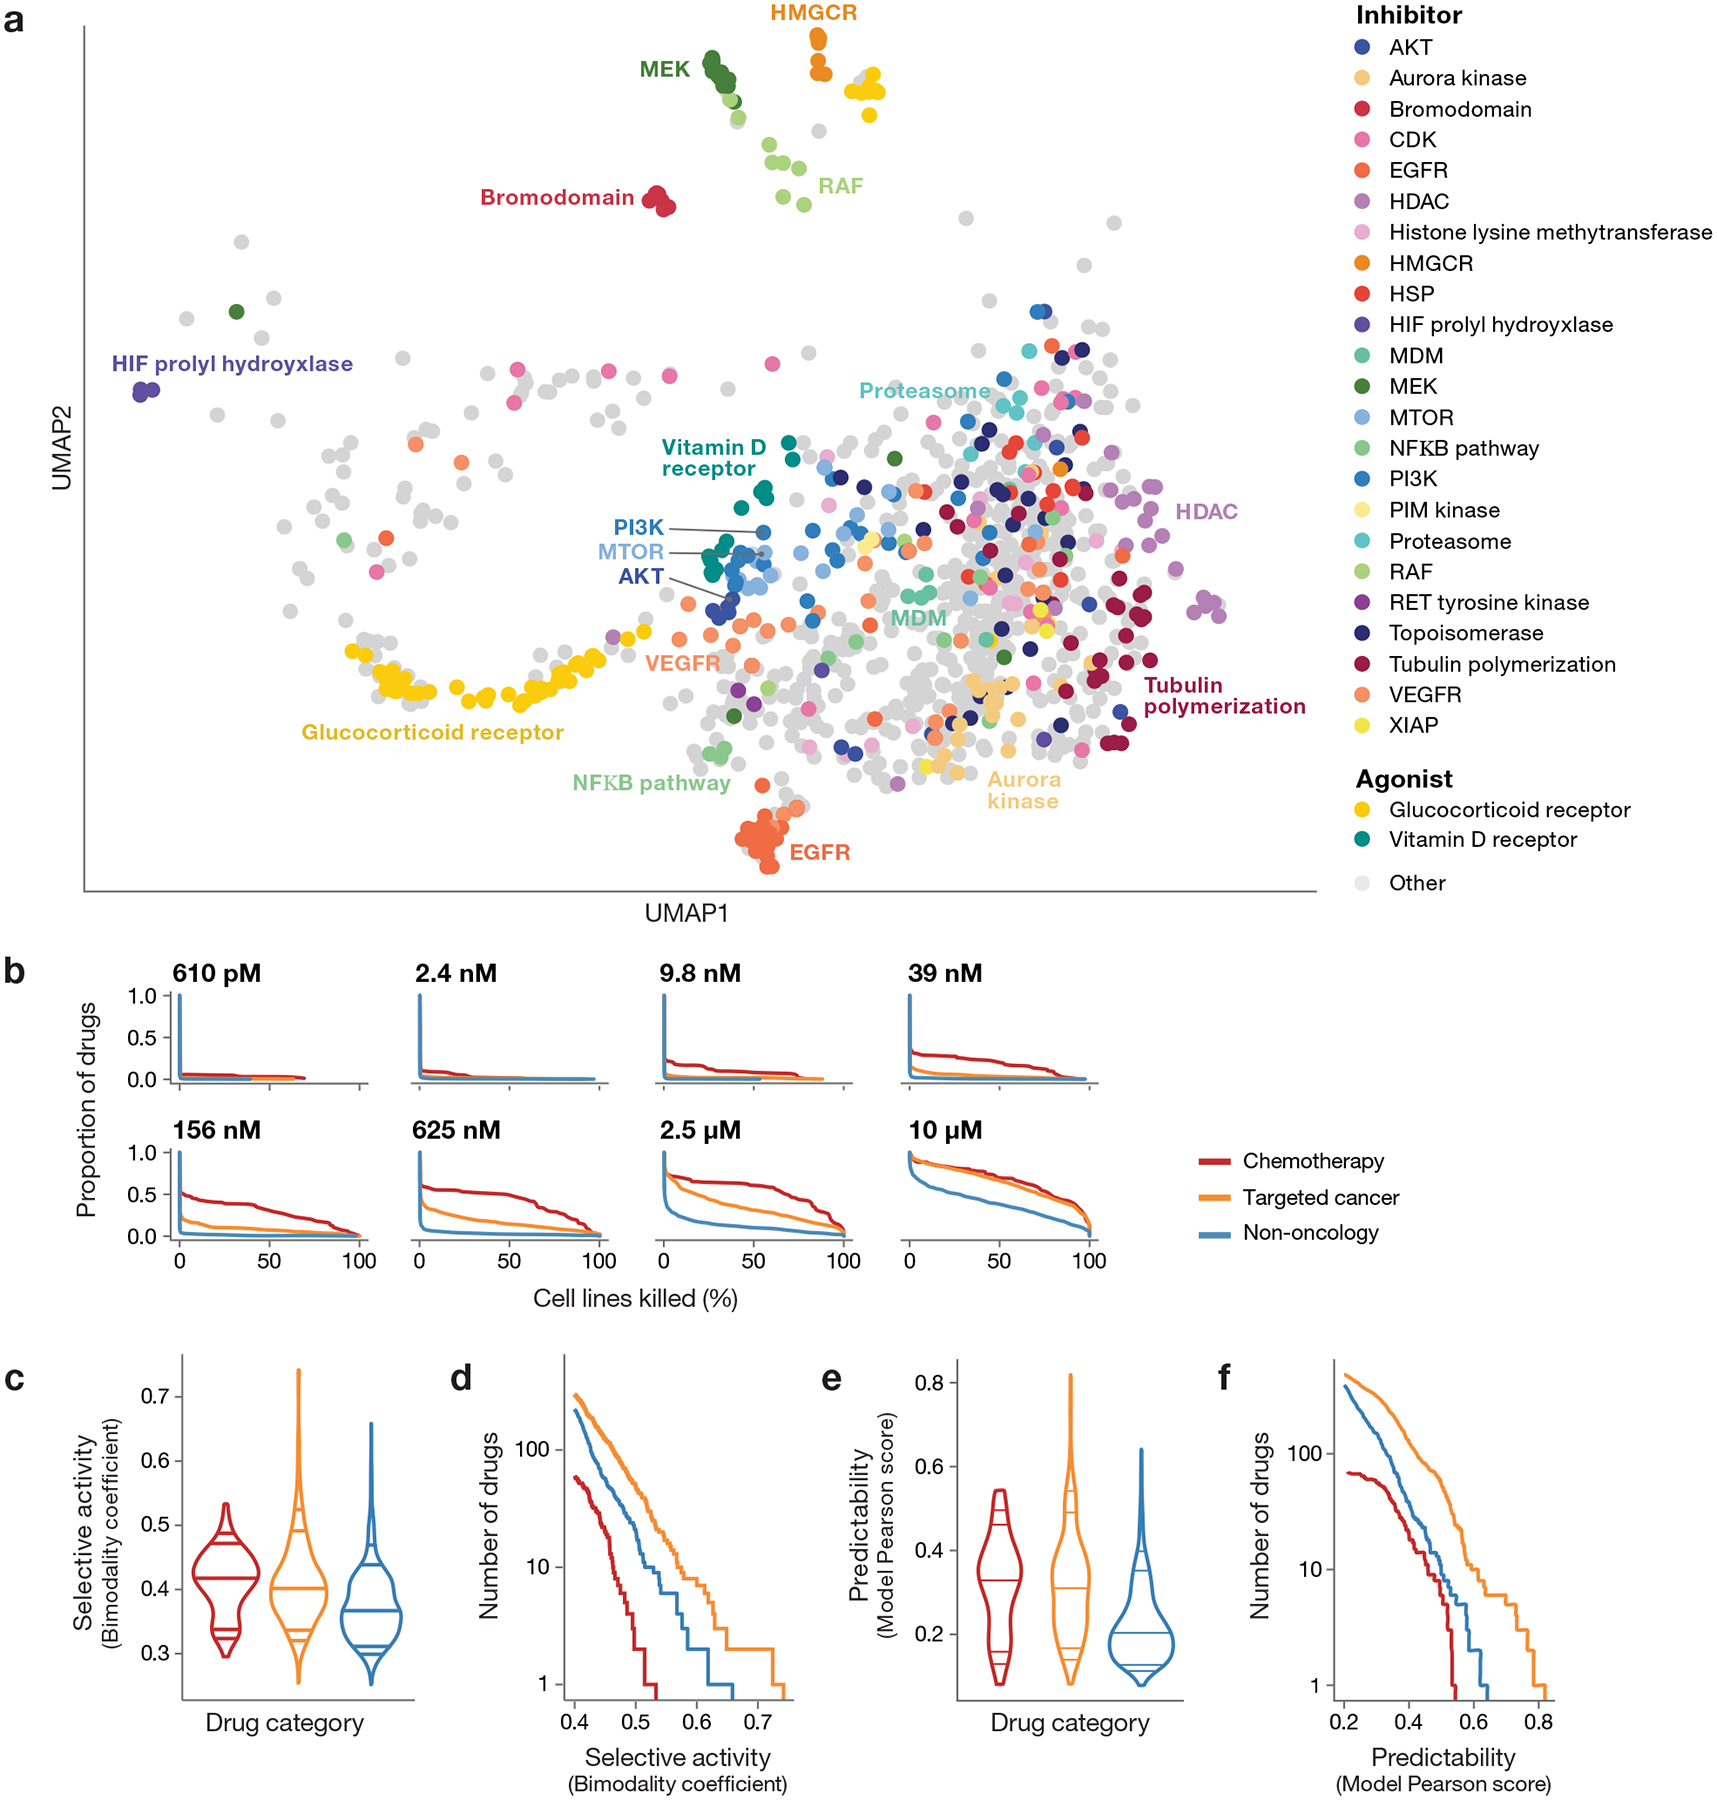
a, Two-dimensional UMAP projection of 990 drug killing profiles by cosine similarity. Compounds with shared annotated mechanism of action are labeled by color (n = 640 compounds). Compounds with average Pearson correlation below 0.25 across 3 independent plates in one PRISM screen are not shown. b, Secondary screen drug activity by dose. Complementary cumulative distribution functions for the percent of cell lines killed in each drug category (chemotherapy: n = 90 compounds, targeted cancer: n = 584 compounds, non-oncology: n = 774 compounds) at each dose of the secondary screen are shown. c, Selective compound activity by drug category. The global distribution of secondary screen bimodality coefficients is shown. Dosewise bimodality coefficients are calculated from log fold-change viability data; the maximum bimodality coefficient is shown for each compound. Violin plot lines correspond to the 5th, 10th, 50th, 90th, and 95th quantiles. d, Most selective sensitivity profiles by drug category. The number of drugs (y-axis) from each drug category with a bimodality coefficient at any dose greater than a given threshold (x-axis) are shown. For visualization purposes, only drugs with bimodality coefficient ≥ 0.4 are included. e, Predictability of compound activity by drug category. (chemotherapy: n = 90, targeted cancer: n = 584, non-oncology: n = 774). Global distribution of secondary screen Pearson scores is shown. ATLANTIS random forest models are trained to predict PRISM log fold-change values using cell line baseline omics and genomic perturbation profiles. The global distribution of secondary screen Pearson scores, defined as the correlation between actual and predicted PRISM profiles, is shown. The maximum Pearson score across all models is used for each compound. Violin plot lines correspond to the 5th, 10th, 50th, 90th, and 95th quantiles. f, Most predictable sensitivity profiles by drug category. The number of drugs (y-axis) from each drug category with a predictive model with a Pearson score greater than a given threshold (x-axis) are shown. For visualization purposes, only drugs with a maximum Pearson score ≥ 0.2 are included.