
Fig. 6. Anti-cancer activity of disulfiram and vanadium.
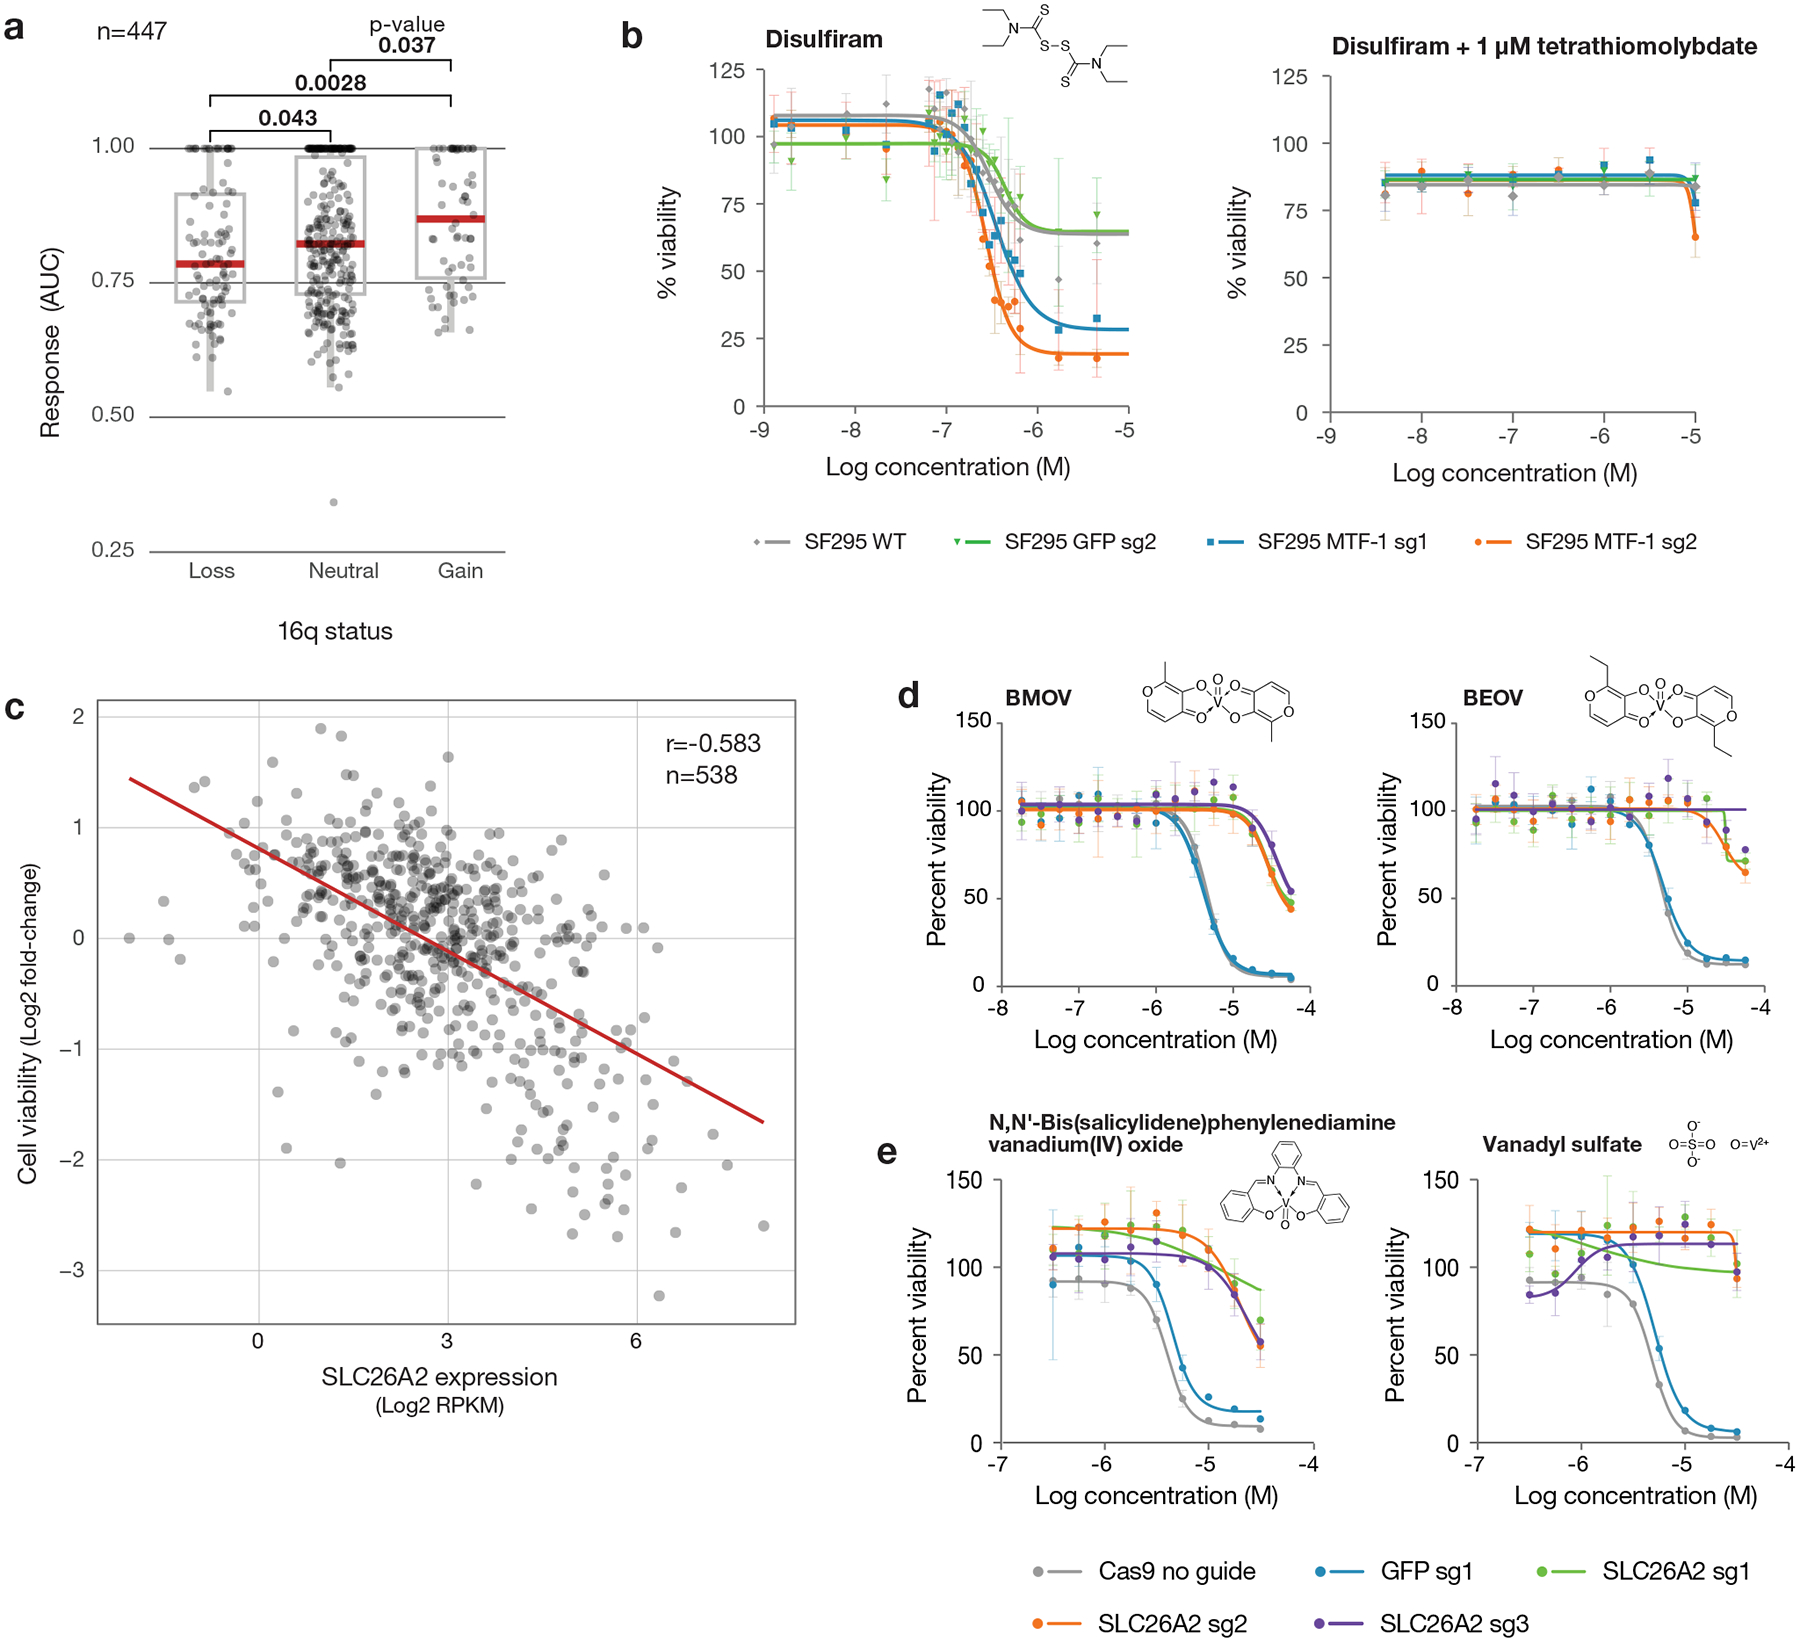
a, Disulfiram sensitivity of PRISM cell lines grouped by 16q copy number status (n= 447 cell lines). PRISM secondary data are shown as AUCs. Arm-level copy number data was obtained using published TCGA methods and manually reviewed to ensure consistency with copy number at the 16q13 locus. Two-sided p-values were calculated using Wilcoxon signed-rank tests between each pair of groups. Upper box limits, center lines, and lower box limits correspond to 75th, 50th, and 25th percentiles, respectively. Whiskers extend from the box limits to the most extreme value up to 1.5 IQR from the median. All cell lines are depicted as points, regardless of outlier status. b, MTF1 loss sensitizes to disulfiram. Drug sensitivity of SF295 cells with and without MTF1 knockout, with sgRNA against GFP included as a non-targeting control. Co-treatment with 1 μM TTM is included. Mean viability across three independently treated wells is shown, with standard deviation indicated by error bars. c, Scatter plot of BMOV sensitivity versus SLC26A2 gene expression (n = 538 cell lines). Correlation between PRISM viability data at 2.5 μM and SLC26A2 gene expression from CCLE RNAseq (log2 RPKM). Pearson’s r is shown. d, SLC26A2 knockout confers resistance. Dose-response curves for BMOV and BEOV in OVISE cells with and without CRISPR/Cas9-mediated knockout of SLC26A2. sgRNA against GFP was included as a non-targeting control. Mean viability across three independently treated wells is shown with standard deviation indicated by error bars. e, Dose-response curves for related vanadium-containing compounds, N,N’-Bis(salicylidene)-o-phenylenediamine vanadium(IV) oxide and vanadyl sulfate, in OVISE cells with and without SLC26A2 knockout. Mean viability across three independently treated wells is shown, with standard deviation indicated by error bars.