
Extended Data Fig. 1. PRISM Repurposing assay and data processing overview.
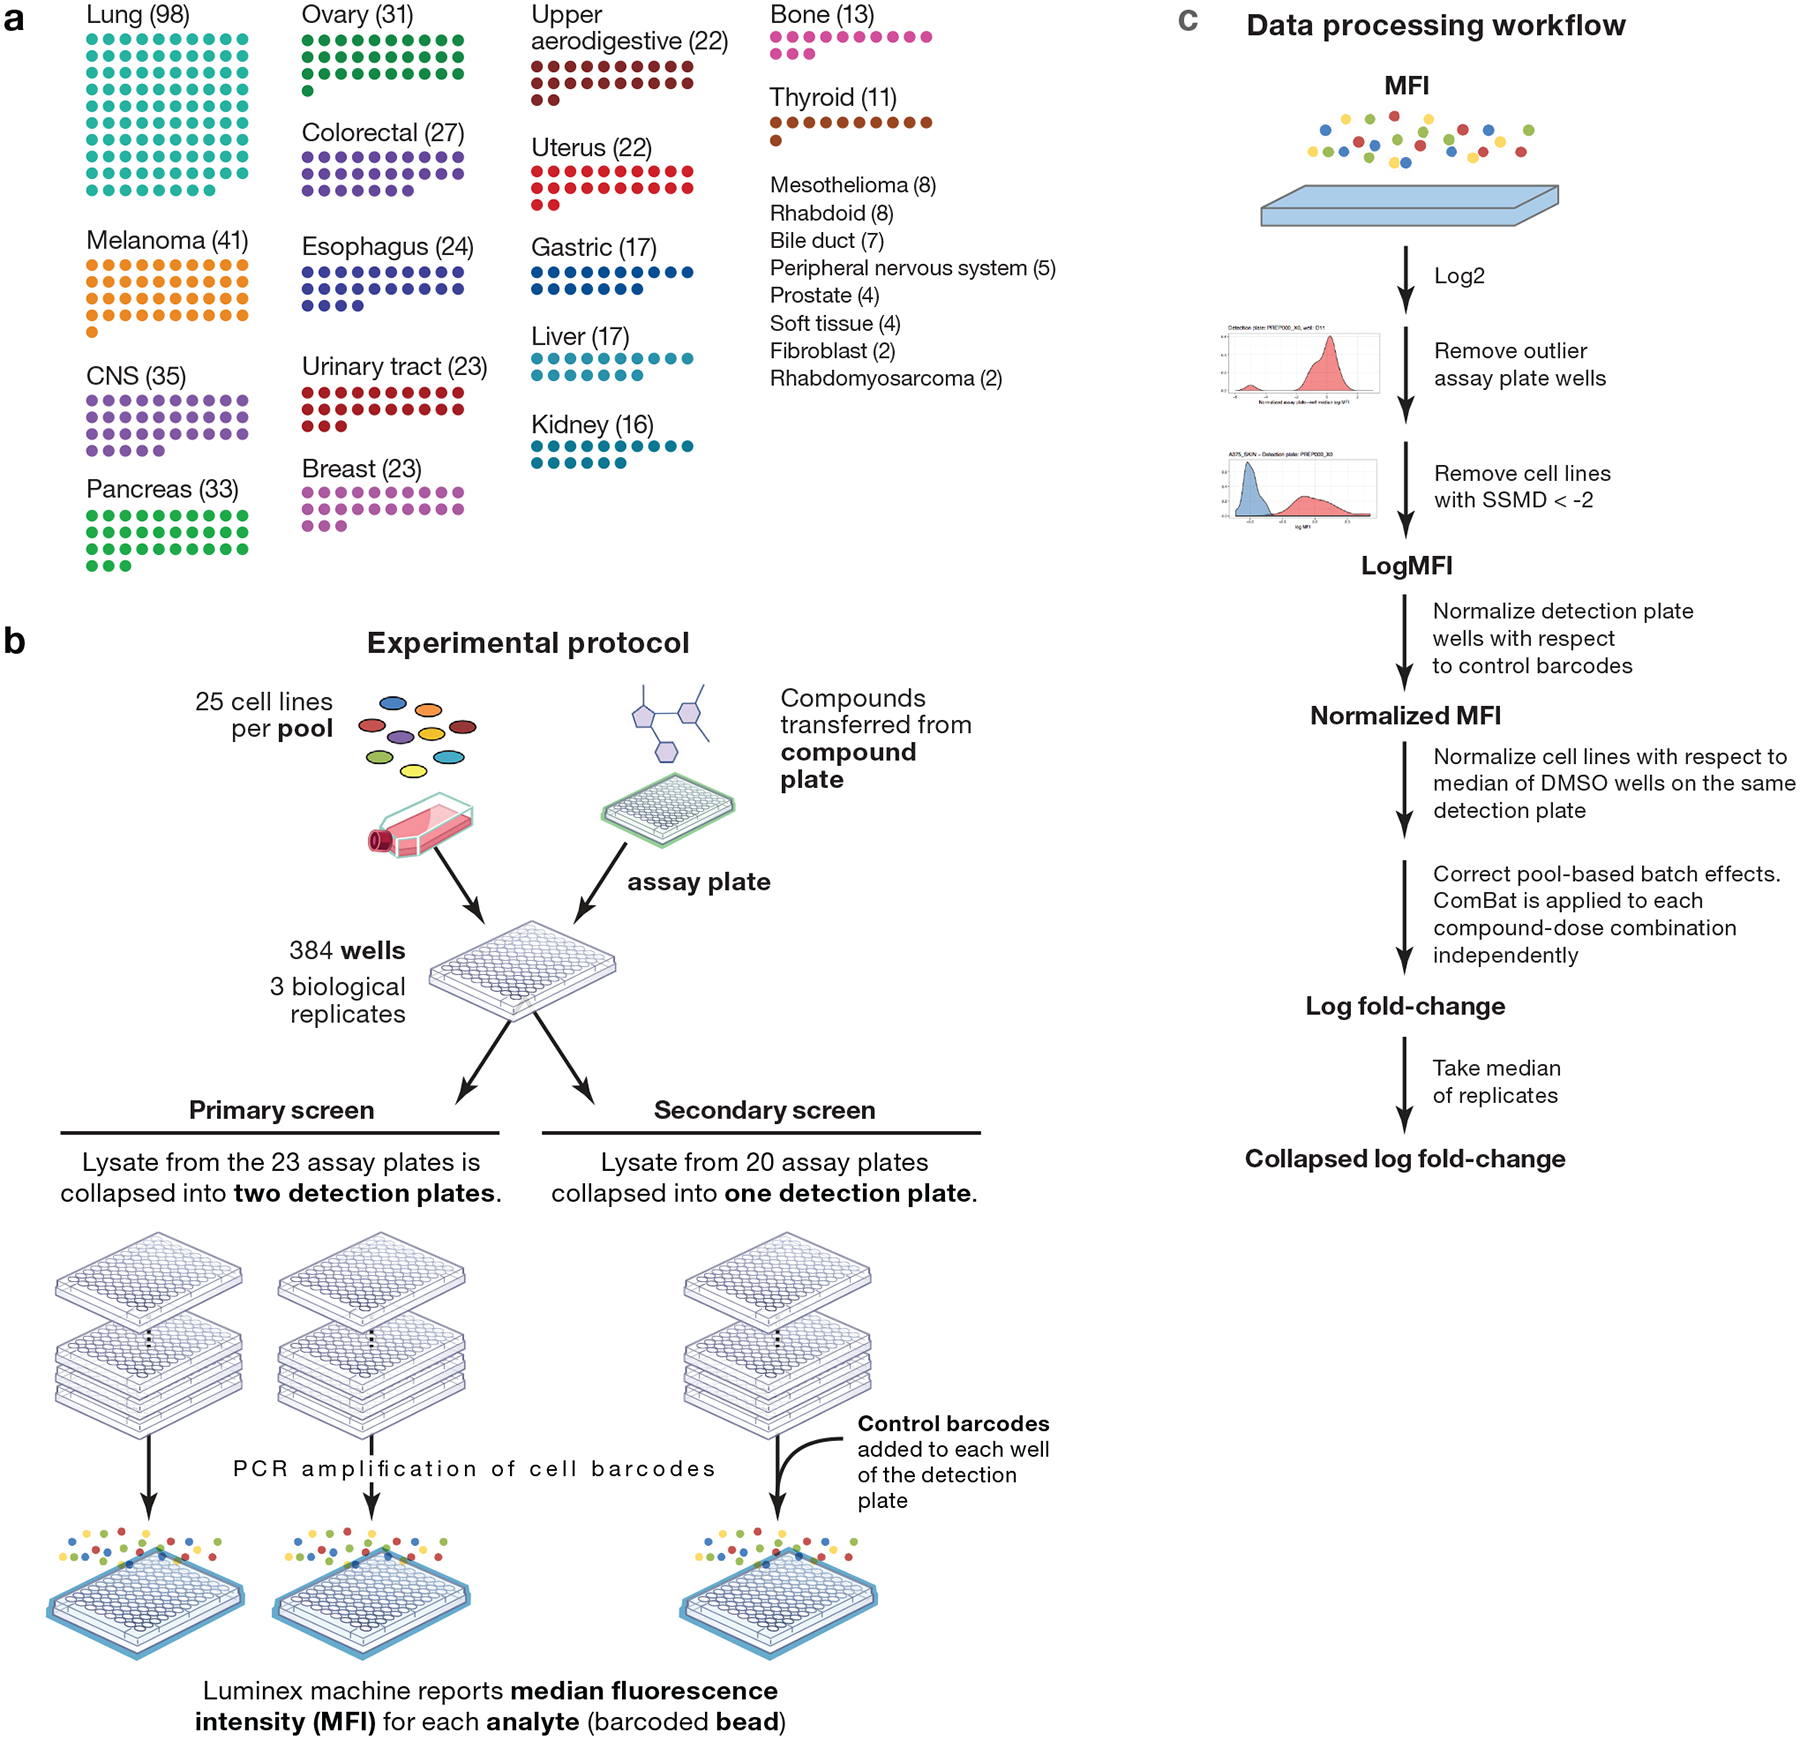
a, Lineage diversity of PRISM cell lines. The 489+ cancer cell lines tested span more than 23 tumor types. Lineages with fewer than 10 cell lines are listed on the right. b, Experimental protocol. Cell lines are grouped by doubling time into pools of approximately 25 cell lines. One pool is plated onto each assay plate. Compounds are transferred by pin transfer from a source compound plate (HTS and HTS002 screens), or cells are plated directly onto assay-ready plates generated by acoustic dispensing of compounds (MTS004, MTS005, and MTS006 screens). In either case, compound plates are shared by all replicates of each treatment condition. After incubation and lysis, all assay plates generated by a given compound plate are grouped and collapsed into 3 (HTS002, MTS005, and MTS006 screens) or 6 (HTS, MTS004 screens) detection plates so that each detection plate receives 1 or zero copies of each pool. Ten control barcodes are then spiked into each detection plate well (HTS002, MTS005, and MTS006 screens). Detection plates are amplified by PCR and detected using Luminex FLEXMAP 3D instruments. c, Data processing workflow. Median Fluorescence Intensity (MFI) values are calculated from fluorescence values for each replicate-condition-cell line combination and are log2-transformed. Assay plates wells are normalized, median-collapsed, and compared to the normalized medians of other assay plate wells in the same well position that have been dosed by the same compound plate. A robust z-score is calculated, and assay plate wells with a |z-score| > 5 are filtered. Strictly standardized mean differences (SSMD) are calculated between positive and negative control conditions for each cell line on each assay plate. Cell line-assay plate combinations with SSMD < 2 are filtered by a control-separation filter to generate the log MFI data matrix. In datasets with control barcodes added, data are normalized with respect to the median of control barcodes to generate the MFI normalized data matrix. Data are DMSO-normalized and pooling artifacts are corrected using ComBat to generate the log fold-change data matrix. Up to 3 independently treated plates (range 1–3 based QC filtering) in one screen are median-collapsed to generate the collapsed log fold-change data matrix.