Abstract
Background:
Gastric cancer (GC) is the most prevailing digestive tract malignant tumor worldwide with high mortality and recurrence rates. However, its potential molecular mechanism and prognostic biomarkers are still not fully understood. We aim to screen novel prognostic biomarkers related to GC prognosis using comprehensive bioinformatic tools.
Methods:
Four gene expression microarray data were downloaded from the Gene Expression Omnibus (GEO) database (GSE26942, GSE33335, GSE63089, and GSE79973). Differentially expressed genes (DEGs) between gastric carcinoma and normal gastric tissue samples were identified by an integrated bioinformatic analysis. Gene Ontology (GO) term enrichment and Kyoto Encyclopedia of Genes and Genomes (KEGG) pathway analysis were performed using statistical software R. STRING and Cytoscape software were employed to construct protein–protein interaction (PPI) networks. Hub genes with a high score of connectivity identified from the PPI network were identified. Prognostic values of hub genes were evaluated in GSE15459 dataset. Hub genes related to GC overall survival were further validated in GEPIA (Gene Expression Profiling Interactive Analysis) online tool.
Results:
A total of 12 upregulated DEGs and 59 downregulated DEGs were identified when the 4 microarray data overlapped. Among them, 10 hub genes with a high score of connectivity were identified. High expression of ghrelin and obestatin prepropeptide (GHRL), BGN, TIMP metallopeptidase inhibitor 1, thrombospondin 2, secreted phosphoprotein 1, and low expression of CHGA were associated with a poor overall survival of gastric cancer (all log rank P < .05). After validation in GEPIA database, only GHRL was confirmed associated with a poor overall survival of gastric cancer (log rank P = .04).
Conclusions:
GHRL could be used as a novel biomarker for the prediction of a poor overall survival of gastric cancer, and could be a novel therapeutic target for gastric cancer treatment. However, future experimental studies are still required to validate these findings.
Keywords: biomarker, gastric cancer, gene expression omnibus, overall survival
1. Introduction
Gastric cancer (GC) is ranked as the fifth most common cancer and second dominant cause of cancer-related death in the world.[1] It was reported that about 24,590 new GC patients and 10,720 related deaths occurred in America in 2015.[2] More than 677,000 individuals have been diagnosed with GC in developing countries, half of which were found in Eastern Asia.[3] With the significant advances in the detection and treatment of gastric cancer, the 5-year relative survival rates for GC patients have improved from 17.8% in 1984 to 22.9% in 2013.[4,5] It may be generally due to the fact that most GC patients are usually asymptomatic in early stages, and are discovered at an advanced stage when obvious symptoms occur, and even with metastatic diseases before timely treatment.[6] GC patients with advanced stage have high recurrence rates after surgical treatment.[7] Therefore, the clinical prognosis of GC remains poor.[8] Thus, it is very important to find specific biomarkers for the early diagnosis, monitoring disease prognosis, and therapeutic target selection of GC.
The Gene Expression Omnibus (GEO) database is a public repository storing high-throughput gene expression data sets. Microarray analysis is a commonly used high-throughput technology for exploring gene expression changes on a global scale. Microarray technology along with integrated bioinformatics analysis can provide a novel and effective method to investigate the molecular mechanisms and prognosis biomarkers of various diseases. Therefore, this study was aimed to identify potential key genes associated with gastric carcinoma overall survival using comprehensive bioinformatic tools.
2. Materials and methods
2.1. Microarray data
Four microarray data on gene expression were downloaded from the GEO database (GSE26942, GSE33335, GSE63089, and GSE79973). All selected datasets met the following requirement: study focus on human stomach tissue samples; study included at least 10 samples; study contained case and control groups. A total of 295 GC samples and 92 normal healthy samples were collected from these datasets. All microarray data needed was freely available online, and ethical approval was not necessary in this study.
2.2. Identification of DEGs in GC
Limma package in R software (version 3.5.1, www.r-project.org) with multiple testing corrections based on the Benjamini and Hochberg method was employed to screen for DEGs in each dataset. The criteria for screening of DEGs were defined as |log2FC| > 1| and adjusted P value < .05. The intersecting part of DEGs in the 4 GEO microarray data was identified using the Venn diagram online webtool (http://bioinfogp.cnb.csic.es/tools/venny/index.html). All shared DEGs were saved in textfile files for further integration analysis.
2.3. Functional and pathway enrichment analyses of DEGs
To explore the potential biological function, molecular functions, cellular components, and Kyoto Encyclopedia of Genes and Genomes (KEGG) signaling pathways associated with the overlapping DEGs of GC from GSE26942, GSE33335, GSE63089, and GSE79973, clusterProfiler and Disease Ontology Semantic and Enrichment analysis package in Bioconductor (https://bioconductor.org/) was used to perform gene ontology (GO) and KEGG pathway analysis. The GO and KEGG analysis results were regarded as statistically significant if P values were less than.05.
2.4. PPI network construction and hub genes identification
Search Tool for the Retrieval of Interacting Genes (STRING) is a freely accessible biological database, which was used to perform the PPI network among all shared DEGs. STRING is a widely used online tool that provides information on protein coexpression relationships. To assess interactive relationships among all DEGs, the DEGs were put into STRING with a combined score > 0.4 and then PPI network was visualized by Cytoscape. Nodes with a high degree of connectivity (proteins encoded by certain genes interact with other proteins encoded by other genes) are selected as hub genes.
2.5. Survival analysis of hub genes in GEO database
Prognostic values of hub genes were evaluated in GSE15459 dataset. It included microarray profiles from 300 gastric tumors from gastric cancer patients with complete clinical prognostic information, which can be used for survival analysis. The hub genes identified associated with overall survival of GC were selected for further analysis.
2.6. Validation of prognostic value of hub genes
The prognostic roles of hub genes determined in gastric cancer samples were also validated by online Gene Expression Profiling Interactive Analysis (GEPIA, http://gepia.cancer-pku.cn/) database. GEPIA is a recently established interactive web server for exploring RNA sequencing expression data that consist of 9736 cancers and 8587 healthy samples from the TCGA and the GTEx projects.[9] Prognostic values of hub genes associated with overall survival of GC identified by GSE15459 dataset were further validated in GEPIA online tool.
2.7. Statistical analyses
DEGs were defined as |log2FC| > 1| and adjusted P value < .05. DEGs were analyzed using the limma package with standard data processing and GO term enrichment analysis, and KEGG pathway analysis was developed using the clusterprofiler package. The Kaplan–Meier estimator was performed on the GEPIA website.
3. Results
3.1. Identification of DEGs and GO and KEGG pathway enrichment analysis
Based on the above-mentioned criteria, a total of 71 DEGs were determined in the intersecting part of the 4 GEO microarray data, comprising 12 upregulated and 59 downregulated DEGs in gastric cancer tissues compared with normal tissues (Fig. 1). The GO enrichment analysis revealed that the DEGs were mainly involved in response to chemical, cellular response to chemical stimulus, plasma membrane, extracellular region, and potassium ion transmembrane transporter activity. Genes are enriched in KEGG pathway termed gastric acid secretion, leukocyte transendothelial migration, extracellular matrix (ECM)-receptor interaction, and collecting duct acid secretion. Details of GO and KEGG pathway enrichment analysis are shown in Fig. 2.
Figure 1.
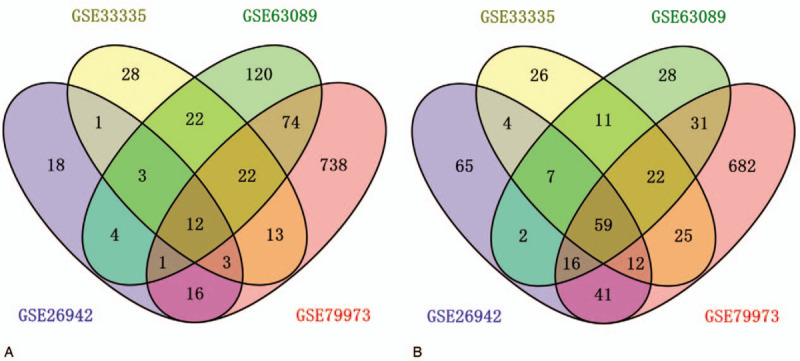
Venn diagram of differentially expressed genes common to all 4 Gene Expression Omnibus datasets. A, Upregulated genes. B, Downregulated genes.
Figure 2.
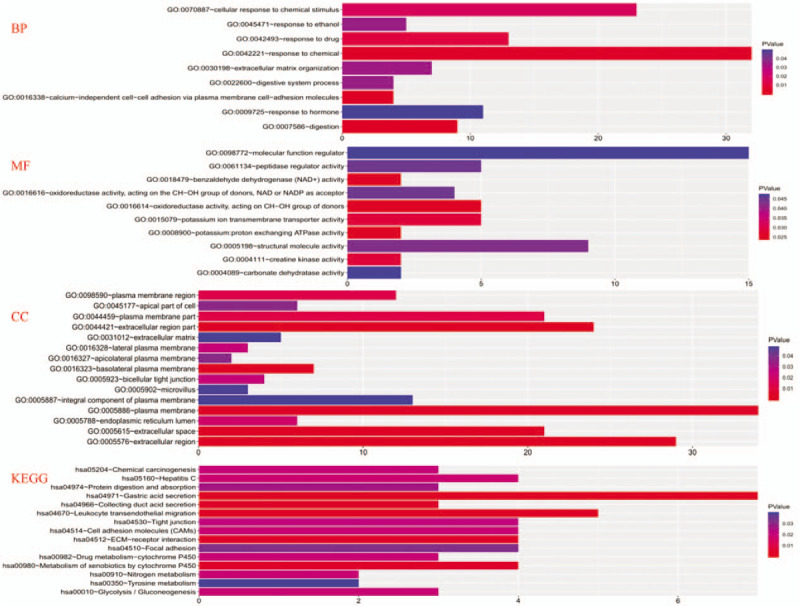
Gene Ontology and Kyoto Encyclopedia of Genes and Genomes enrichment analysis for all differentially expressed genes. BP = biological function, MF = molecular functions, CC = cellular components, KEGG = Kyoto Encyclopedia of Genes and Genomes.
3.2. PPI network construction and hub genes identification
A PPI network was performed using the STRING tools online database using the 71 DEGs and was visualized by Cytoscape. PPI network with required interaction score > 0.4 was constructed with 71 nodes and 77 edges (Fig. 3). The number of links between genes was calculated, and the top 10 outstanding nodes with high score of connectivity (COL1A1, BGN, secreted phosphoprotein 1 (SPP1), ATR4A, thrombospondin 2 (THBS2), TIMP metallopeptidase inhibitor 1 (TIMP1), CCKBR, CHGA, ghrelin and obestatin prepropeptide (GHRL), and SST) were identified using the default maximal clique centrality method in cytoHubba (Fig. 4).
Figure 3.
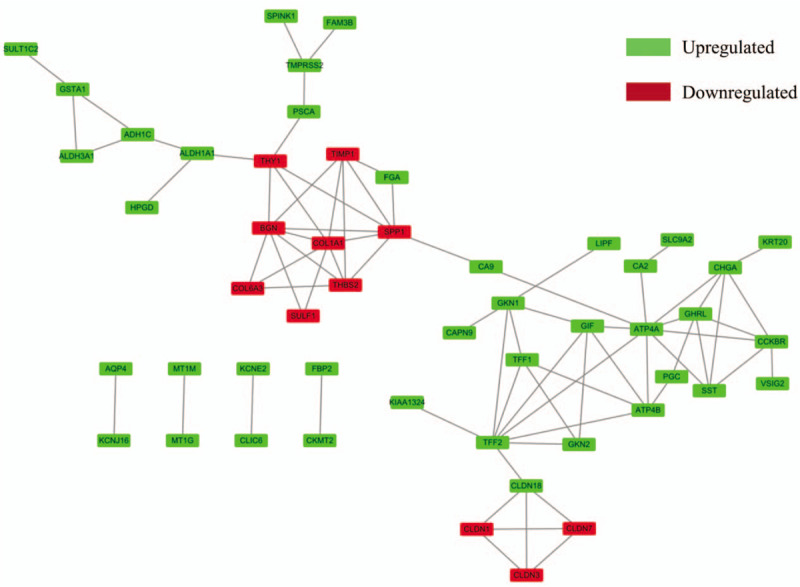
Protein–protein interaction networks constructed with all differentially expressed genes. Red nodes represent upregulated genes, and blue nodes represent downregulated genes.
Figure 4.
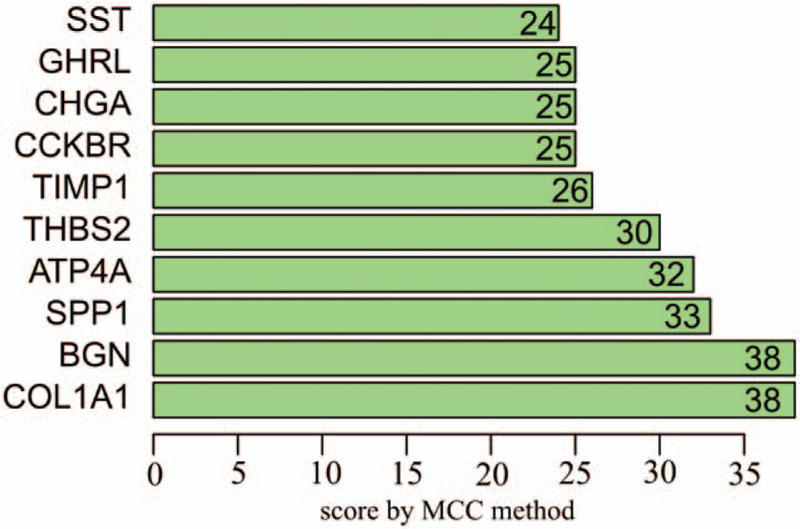
Top 10 most connected genes of protein–protein interaction that are arranged by score using the default MCC method. The vertical indicates the gene name, and the horizontal coordinates is the score of connected genes. MCC = maximal clique centrality.
3.3. Survival analysis of hub genes in GSE15459 dataset
Among the 10 hub genes, it was found that the high expression of TIMP1, THBS2, SPP1, BGN, and GHRL (all differentially expressed upregulated genes) was associated with a poor overall survival of gastric cancer (P = 1.779e-05, 2.324e-06, 2.251e-04, 6.764e-05, 4.096e-02, respectively). Low expression of differentially expressed downregulated gene of CHGA was related to a poor overall survival of gastric cancer (P = 6.629e-03, respectively, Fig. 5).
Figure 5.
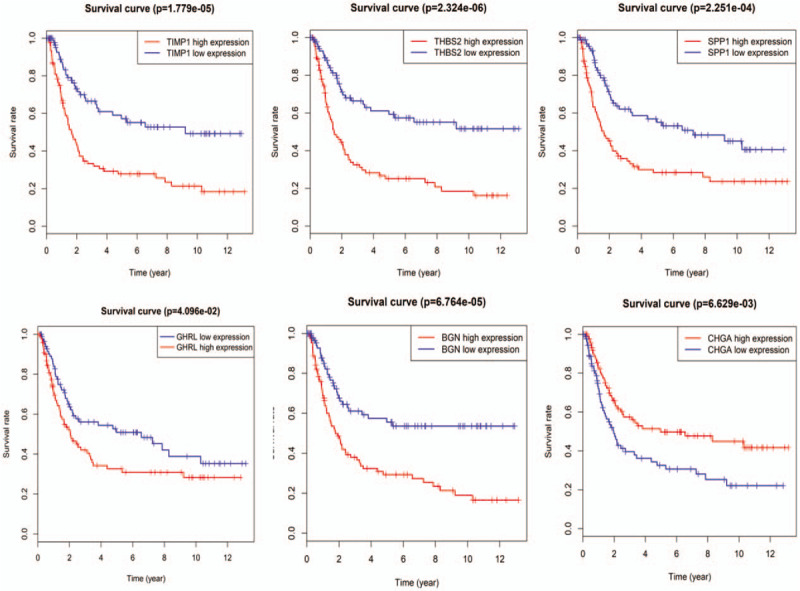
Prognosis roles of 6 hub genes related to overall survival in gastric cancer patients in GSE15459 dataset.
3.4. Validation of prognostic values of hub genes
Prognostic values of 6 hub genes related to overall survival of GC identified by GSE15459 dataset were validated using GEPIA. Among the 6 hub genes, it was found that the high expression of GHRL (HR = 1.4, log rank P = .04) was related to a poor overall survival for GC patients. However, the elevated expression level of rest of the genes was not relevant to poor overall survival for GC patients (Fig. 6). Based on the prognostic value analysis of hub genes, the elevated expression level of GHRL was associated with a poor overall survival in gastric cancer.
Figure 6.
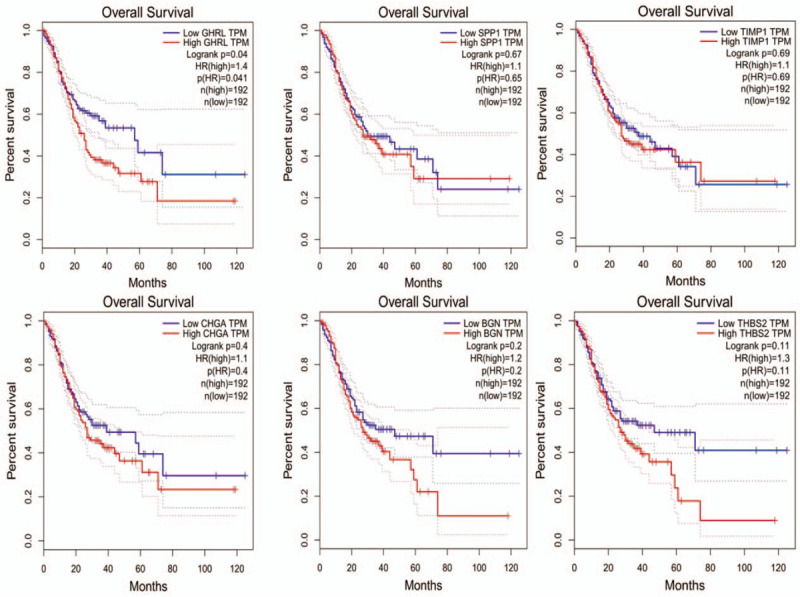
Prognosis roles of hub genes related to overall survival in gastric cancer patients in Gene Expression Profiling Interactive Analysis database.
4. Discussion
As the fourth most prevalent cancer in the world, GC is an international health problem.[10] A large number of biomarkers were involved in GC development. Therefore, specific biomarkers for the diagnosis, treatment, and prognosis of GC were urgently needed.[11] Microarrays are impactful tools for exploring the pathogenesis of human cancer and identifying specific targets.[12] It was widely accepted that the stage of disease at diagnosis was evidently associated with the prognosis of gastric cancer. Therefore, exploring promising diagnostic and prognostic biomarkers as early as possible might contribute to gastric cancer pathogenesis.
In this study, a comprehensive analysis of 4 GEO datasets was conducted and 71 DEGs were determined in the overlapped datasets, comprising 12 upregulated and 59 downregulated DEGs. The GO enrichment analysis indicated that these DEGs were significantly enriched in cellular response to chemical stimulus, plasma membrane, extracellular region, and potassium ion transmembrane transporter activity. KEGG pathway is mainly enriched in gastric acid secretion, ECM-receptor interaction, and collecting duct acid secretion. According to PPI network, top 10 hub genes were identified. Only GHRL was associated with an overall survival in GC. The high expression level of GHRL was involved in a poor prognosis in GC.
GHRL, which encodes a 28-amino acid peptide hormone, was initially purified from the stomach mucosa and serves as the ligand for the growth hormone secretagogue receptor.[13] Previous studies have revealed the expression of GHRL in pancreatic cancer, thyroid cancer, lung cancer, breast cancer, colorectal cancer, ovarian cancer, and gastric cancer.[14–18] The high expressed level of GHRL was reported in several human tumors, including in kidney cancer, bile duct cancer, lung cancer, breast cancer, glioma, prostate cancer, sarcoma, endometrioid cancer, and acute myeloid lymphoma, indicating the potential pathological role of GHRL in cancer.[19] Increased mRNA expression of GHRL in kidney cancer has been found in metastatic sites, including bone, lung, and adrenal gland.[20] Furthermore, GHRL is also expressed in liver metastases from primary gastric cancer.[21] Overall, these results indicate that GHRL might be a vital factor in cancer metastasis and progression. The previous study revealed that the expression level of GHRL in renal cell carcinoma is an independent biomarker that related to adverse progression.[20] However, the prognostic value of GHRL in gastric cancer has not been well established. In the present bioinformatic study, we suggest that GHRL may act as a novel biomarker for the prediction poor overall survival of gastric cancer.
Therefore, we hypothesize that GHRL could be used as a novel biomarker for diagnosis as well as prediction of a poor overall survival of GC, and could be novel therapeutic targets for GC treatment. However, the conclusions made are based on bioinformatics data. Further experimental studies are still required to verify these findings.
Acknowledgments
The authors thank the efforts of the Gene Expression Omnibus database (https://www.ncbi.nlm.nih.gov/geo/) and GEPIA (http://gepia.cancer-pku.cn/) in the creation of the databases.
Author contributions
Conceptualization: Xiandan Wu, Yongning Wu, Binhua Ye, Peien Wang.
Data curation: Xiandan Wu, Yongning Wu, Binhua Ye, Fubin Wu, Peien Wang.
Formal analysis: Yongning Wu, Binhua Ye.
Investigation: Xiandan Wu, Binhua Ye, Fubin Wu, Peien Wang.
Methodology: Xiandan Wu, Yongning Wu, Peien Wang.
Project administration: Binhua Ye.
Resources: Binhua Ye, Fubin Wu.
Software: Xiandan Wu.
Supervision: Xiandan Wu, Yongning Wu, Binhua Ye, Fubin Wu, Peien Wang.
Validation: Peien Wang.
Visualization: Fubin Wu.
Writing – original draft: Yongning Wu.
Writing – review & editing: Peien Wang.
Footnotes
Abbreviations: DEGs = differentially expressed genes, GC = gastric cancer, GEO = gene expression omnibus, GEPIA = gene expression profiling interactive analysis, GHRL = ghrelin and obestatin prepropeptide, GO = gene ontology, KEGG = Kyoto encyclopedia of genes and genomes, OS = overall survival, PPI = protein–protein interaction.
How to cite this article: Wu X, Wu Y, Ye B, Wu F, Wang P. High expression of ghrelin and obestatin prepropeptide in tumor tissues predicted adverse overall survival in gastric carcinoma patients. Medicine. 2020;99:26(e20635).
XW and YW contributed equally to this work and should be considered cofirst authors.
All the data needed in the study are available from online Gene Expression Omnibus database (https://www.ncbi.nlm.nih.gov/geo/) and GEPIA (http://gepia.cancer-pku.cn/).
Ethical approval was not necessary since the datasets used in the present study are available from Gene Expression Omnibus database (https://www.ncbi.nlm.nih.gov/geo/) and GEPIA (http://gepia.cancer-pku.cn/), which are all open to all.
The authors have no conflicts of interest to disclose.
The datasets generated during and/or analyzed during the current study are publicly available.
References
- [1].Fitzmaurice C, Dicker D, Pain A, et al. The Global Burden of Cancer 2013. JAMA Oncol 2015;1:505–27. [DOI] [PMC free article] [PubMed] [Google Scholar]
- [2].Siegel RL, Miller KD, Jemal A. Cancer statistics, 2015. CA Cancer J Clin 2015;65:5–29. [DOI] [PubMed] [Google Scholar]
- [3].Ferlay J, Soerjomataram I, Dikshit R, et al. Cancer incidence and mortality worldwide: sources, methods and major patterns in GLOBOCAN 2012. Int J Cancer 2015;136:E359–386. [DOI] [PubMed] [Google Scholar]
- [4].Wang J, Sun Y, Bertagnolli MM. Comparison of gastric cancer survival between Caucasian and Asian patients treated in the United States: results from the Surveillance Epidemiology and End Results (SEER) database. Ann Surg Oncol 2015;22:2965–71. [DOI] [PubMed] [Google Scholar]
- [5].Orditura M, Galizia G, Sforza V, et al. Treatment of gastric cancer. World J Gastroenterol 2014;20:1635–49. [DOI] [PMC free article] [PubMed] [Google Scholar]
- [6].Leung WK, Wu MS, Kakugawa Y, et al. Screening for gastric cancer in Asia: current evidence and practice. Lancet Oncol 2008;9:279–87. [DOI] [PubMed] [Google Scholar]
- [7].D’Angelica M, Gonen M, Brennan MF, et al. Patterns of initial recurrence in completely resected gastric adenocarcinoma. Ann Surg 2004;240:808–16. [DOI] [PMC free article] [PubMed] [Google Scholar]
- [8].Sun F, Sun H, Mo X, et al. Increased survival rates in gastric cancer, with a narrowing gender gap and widening socioeconomic status gap: a period analysis from 1984 to 2013. J Gastroenterol Hepatol 2018;33:837–46. [DOI] [PubMed] [Google Scholar]
- [9].Tang Z, Li C, Kang B, et al. GEPIA: a web server for cancer and normal gene expression profiling and interactive analyses. Nucleic Acids Res 2017;45:W98–102. [DOI] [PMC free article] [PubMed] [Google Scholar]
- [10].Cao L, Chen Y, Zhang M, et al. Identification of hub genes and potential molecular mechanisms in gastric cancer by integrated bioinformatics analysis. PeerJ 2018;6:e5180. [DOI] [PMC free article] [PubMed] [Google Scholar]
- [11].Fakhri B, Lim KH. Molecular landscape and sub-classification of gastrointestinal cancers: a review of literature. J Gastrointest Oncol 2017;8:379–86. [DOI] [PMC free article] [PubMed] [Google Scholar]
- [12].Mardis ER. A decade's perspective on DNA sequencing technology. Nature 2011;470:198–203. [DOI] [PubMed] [Google Scholar]
- [13].He C, Tsend-Ayush E, Myers MA, et al. Changes in the ghrelin hormone pathway maybe part of an unusual gastric system in monotremes. Gen Comp Endocrinol 2013;191:74–82. [DOI] [PubMed] [Google Scholar]
- [14].Volante M, Allia E, Gugliotta P, et al. Expression of ghrelin and of the GH secretagogue receptor by pancreatic islet cells and related endocrine tumors. J Clin Endocrinol Metab 2002;87:1300–8. [DOI] [PubMed] [Google Scholar]
- [15].Volante M, Allia E, Fulcheri E, et al. Ghrelin in fetal thyroid and follicular tumors and cell lines: expression and effects on tumor growth. Am J Pathol 2003;162:645–54. [DOI] [PMC free article] [PubMed] [Google Scholar]
- [16].Nikolopoulos D, Theocharis S, Kouraklis G. Ghrelin's role on gastrointestinal tract cancer. Surg Oncol 2010;19:e2–10. [DOI] [PubMed] [Google Scholar]
- [17].Cassoni P, Papotti M, Ghe C, et al. Identification, characterization, and biological activity of specific receptors for natural (ghrelin) and synthetic growth hormone secretagogues and analogs in human breast carcinomas and cell lines. J Clin Endocrinol Metab 2001;86:1738–45. [DOI] [PubMed] [Google Scholar]
- [18].Bai RX, Wang WP, Zhao PW, et al. Ghrelin attenuates the growth of HO-8910 ovarian cancer cells through the ERK pathway. Braz J Med Biol Res 2016;49:e5043. [DOI] [PMC free article] [PubMed] [Google Scholar]
- [19].Lin TC, Hsiao M. Ghrelin and cancer progression. Biochimica Biophysica Acta Rev Cancer 2017;1868:51–7. [DOI] [PubMed] [Google Scholar]
- [20].Lin TC, Liu YP, Chan YC, et al. Ghrelin promotes renal cell carcinoma metastasis via Snail activation and is associated with poor prognosis. J Pathol 2015;237:50–61. [DOI] [PubMed] [Google Scholar]
- [21].Tsolakis AV, Portela-Gomes GM, Stridsberg M, et al. Malignant gastric ghrelinoma with hyperghrelinemia. J Clin Endocrinol Metab 2004;89:3739–44. [DOI] [PubMed] [Google Scholar]


