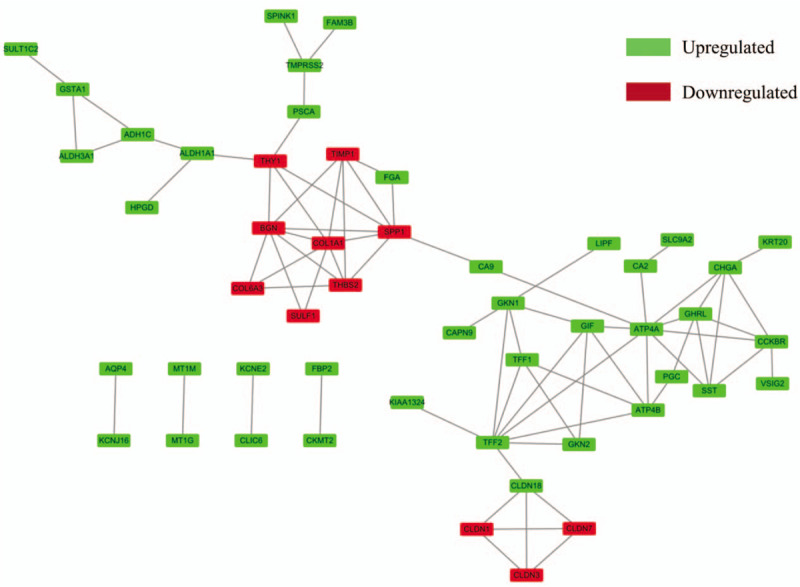
Figure 3.

Protein–protein interaction networks constructed with all differentially expressed genes. Red nodes represent upregulated genes, and blue nodes represent downregulated genes.

Protein–protein interaction networks constructed with all differentially expressed genes. Red nodes represent upregulated genes, and blue nodes represent downregulated genes.