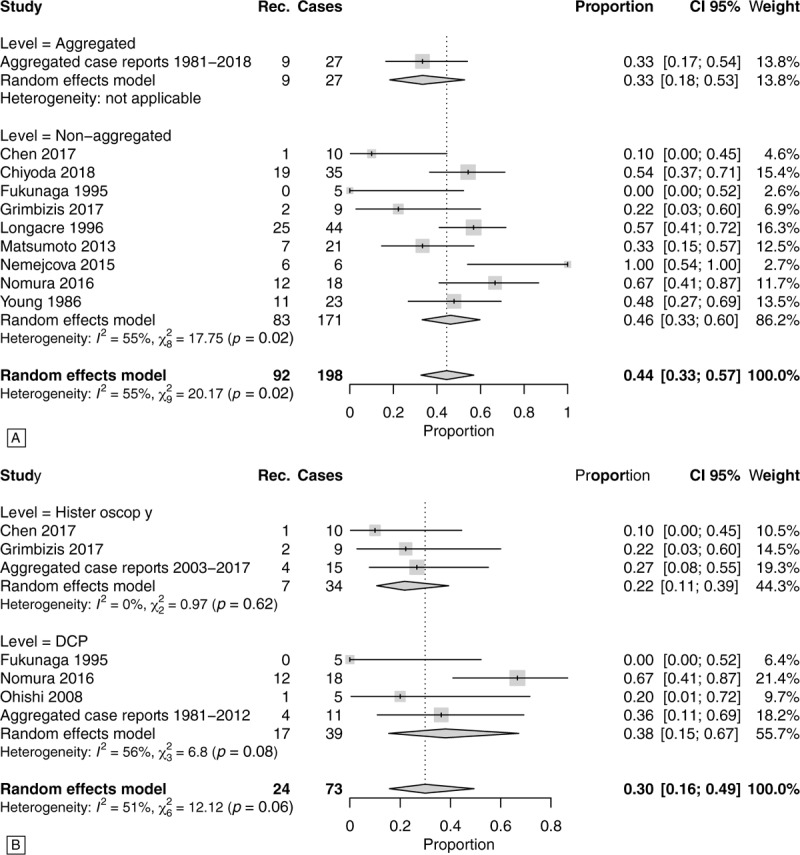
Figure 3.

Summary forest plots of APA recurrences without considering the specific time-to-event follow-up. Panel A: Forest-plot of APA relapse prevalence. Case series with <5 cases and individual case reports were aggregated. Panel B: In this forest-plot data were stratified by type of conservative treatment DCP versus operative histeroscopy (for this analysis we did not stratified between aggregated and non-aggregated data). Case series with <5 cases and individual case reports were aggregated. APA = atypical polypoid adenomyoma, DCP = dilatation, curettage and polypectomy.
