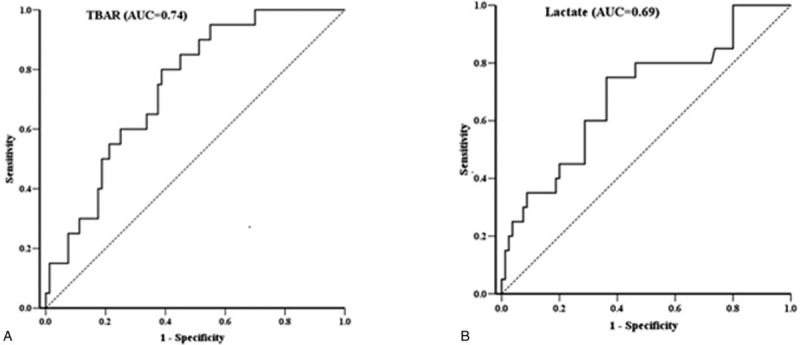
Figure 3.

Receiver operating characteristic (ROC) curve for antioxidant and inflammatory parameters. The diagnostic accuracy of biomarkers displayed after analyzing the ROC curve. (a) Serum TBARS (thiobarbituric acid-reactive substances), (b) Plasma lactate; area under the curve.
