
Figure 1:
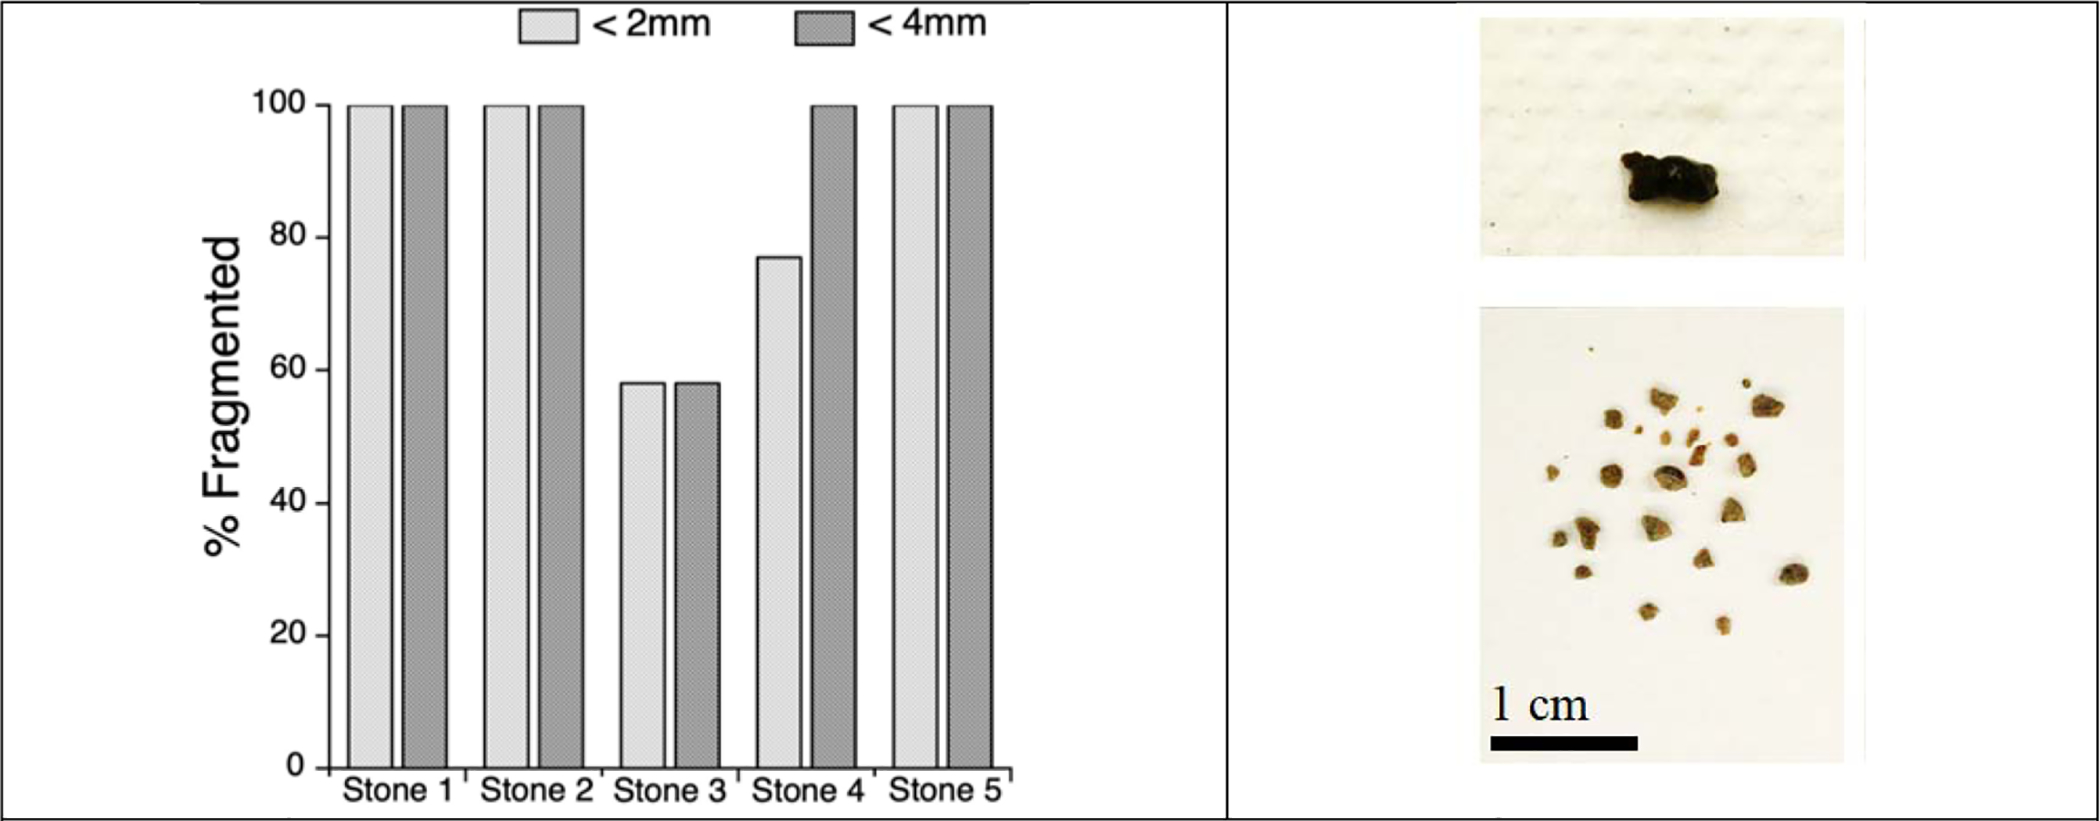
a) Bar chart showing the percent fragmentation of each treated stone to <2 and <4 mm. b) example of stone before treatment (top) and after treatment (bottom)
Official websites use .gov
A
.gov website belongs to an official
government organization in the United States.
Secure .gov websites use HTTPS
A lock (
) or https:// means you've safely
connected to the .gov website. Share sensitive
information only on official, secure websites.
a) Bar chart showing the percent fragmentation of each treated stone to <2 and <4 mm. b) example of stone before treatment (top) and after treatment (bottom)