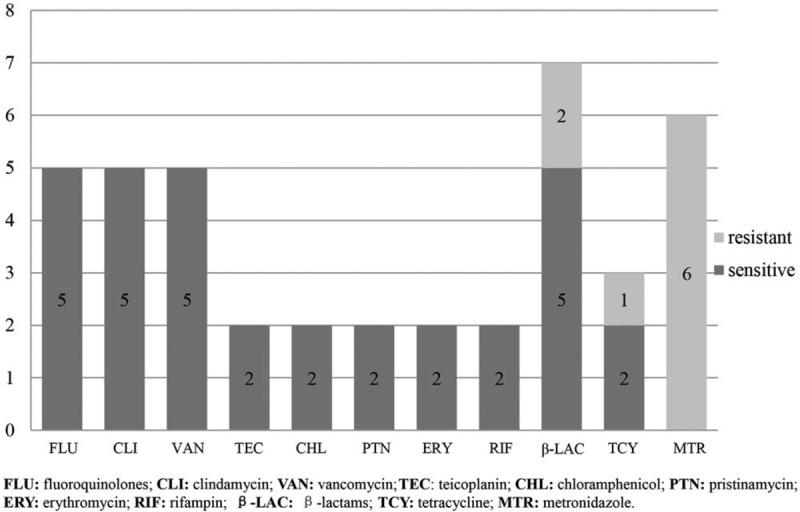
Figure 4.

Cases with available drug susceptibility results for each antibiotic. The bars indicate the number of cases with available results. The proportions of the cases sensitive and resistant to each antibiotic are shown in black and gray, respectively, with the number in the bars.
