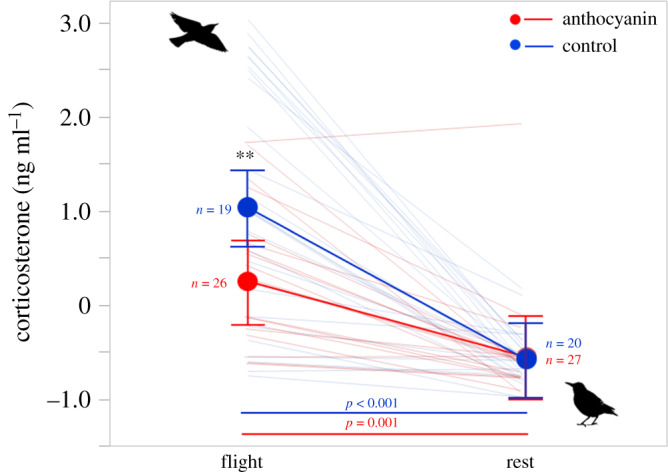
Figure 1.

Circulating levels of baseline corticosterone (taken within 3 min from capture in spring and autumn) after flight (‘flight’ in x-axis) and 48 h after flight (‘rest’ in x-axis). Dots (red for anthocyanin treatment) represent least squares means; bars are 95% confidence intervals. Asterisks represent within-time/between-treatment post-hoc results (**=p < 0.01); coloured lines and related p-values represent between-time/within treatment comparisons. Sample size refers to total observations per each group and time point. All variables were z-scored but units of measures were reported for clarity. See electronic supplementary material, table S1 for means of raw data.
