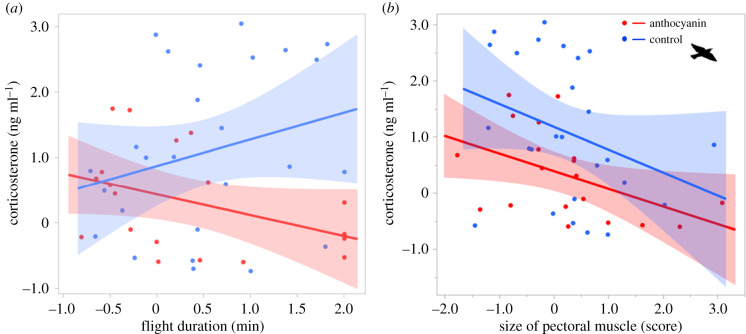
Figure 2.
Relationship between circulating corticosterone and (a) actual amount of time spent flying (only time point ‘after flight’ considered) and (b) mass of pectoral muscle. Data for spring and autumn have been combined. Red colour for individual dots, regression line and shaded confidence region represent anthocyanin birds; blue colour for controls. All variables were z-scored but units of measures were reported for clarity. See electronic supplementary material, table S1 for means of raw data.

