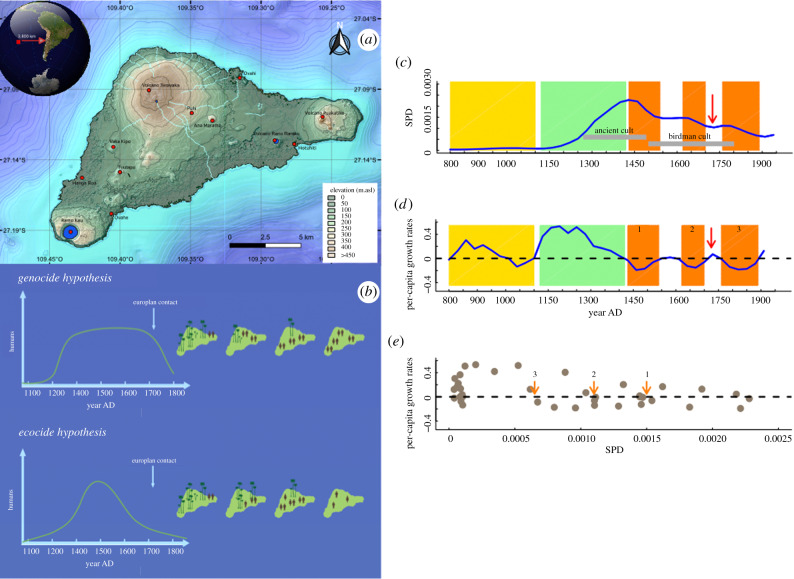
Figure 1.
Population data and hypotheses description. (a) Map of Rapa Nui showing the major topographic features of the island. (b) Two hypotheses previously proposed for explaining the socio-ecological trajectory of Rapa Nui. The ecocide hypothesis: human population increased exponentially since its initial colonization. Human populations overshot the carrying capacity to support sustainable crops, and in consequence, the island was severely deforested. Such exhaustion of natural resources led to socio-demographic collapse. The genocide hypothesis: human population grew exponentially since approximately 1150 CE, reached the carrying capacity, but maintained a stable population size and sustainable crops despite deforestation. The collapse occurred after European colonization [14]. (c) Reconstructed SPD for Rapa Nui. Yellow and green vertical bars denote periods of low and exponential population growths, respectively. Orange areas indicate periods with negative population growth rates. The red arrow indicates the arrival of Europeans. (d) Time-series for per-capita growth rates (blue line) showing the chronology and magnitude of the three demographic collapses (orange bars). (e) R function plotted against the reconstructed SPD (one generation before = 30 years). Orange arrows indicate equilibrium population sizes during the three declines. Departure >0 implies a stronger relationship between SPD values and per-capita growth rates. (Online version in colour.)

