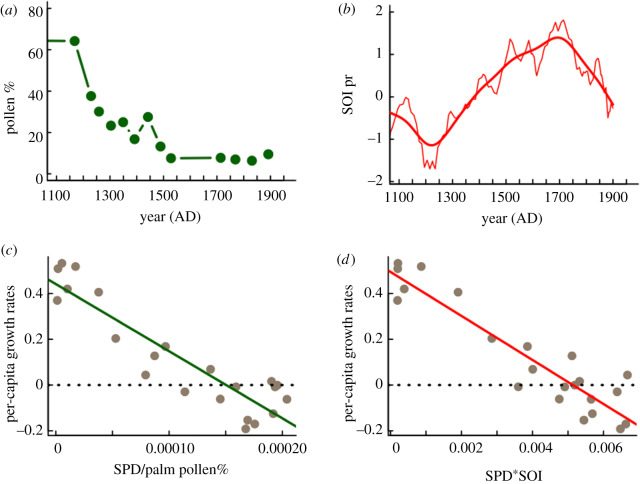
Figure 2.
Palaeoenvironmental data. (a) Time series for the percentage of palm pollen (green line and dots) from the Raraku lacustrine record covering the period 1100–1960 CE [21]. (b) SOI reconstruction (SOIpr), annually resolved (red thin line) and smoothed time series [39]. (c) Relationship between per-capita growth rates and the SPD per unit of palm pollen % for the same period (line fitted by linear regression; y = 0.44 – 2935x, F1,20 = 97.23, p < 0.0001, r2 = 0.82). (d) Relationship between per-capita growth rates and the SPD by the unit of the Southern Index Oscillation for the same period (line fitted by linear regression; y = 0.49–96.25x, F1,20 = 126.3, p < 0.0001, r2 = 0.86). (Online version in colour.)

