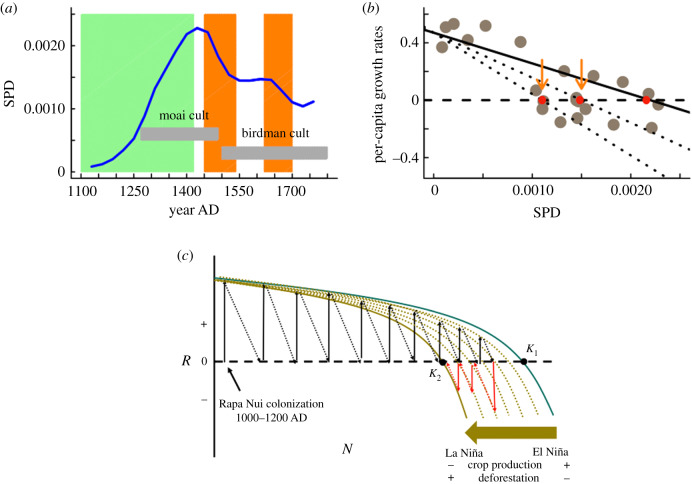
Figure 4.
Graphical representations for the best model. (a) The observed population dynamic pattern from SPD data. (b) The effect of lateral perturbations caused by decreased crop production (or available land) either from palm tree cover or ENSO-induced hydroclimate anomalies. K represents the first equilibrium population size, and orange arrows denote reconstructed consecutive population declines. Solid and dotted lines are the graphical representations of the lateral perturbation effect. (c) Gradual changes in the island carrying capacity caused by a lateral perturbation process. The population trajectory of the Rapa Nui population in terms of the relationship between per-capita growth rates (R) and population size (N). The green solid curve represents the population logistic model with the carrying capacity K1 at the initial colonization (1100–1200 CE). The gradual deterioration of the carrying capacity (dotted brown lines) is driven by negative hydroclimatic changes that lead to low crop productivity, intense land use and deforestation and in turn a lower equilibrium population size, K2. Solid and dashed arrows illustrate demographic trajectories since the colonization (black arrows positive growth rates) to the collapses (red arrows negative growth rates). (Online version in colour.)

