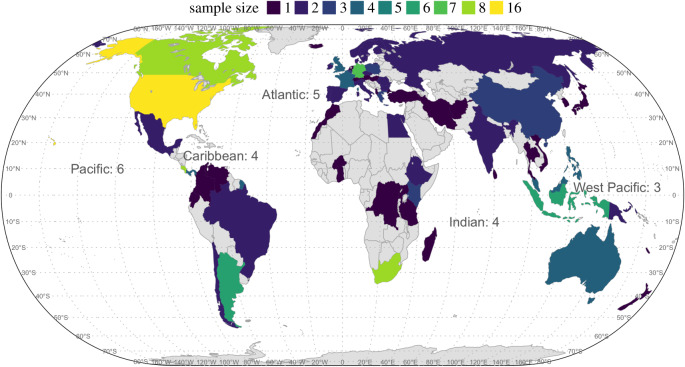
Figure 1.
Geographical distribution of the 162 datasets used in this analysis. Colour shading reflects the number of datasets in each country, and the number of datasets per ocean is reported in the text. We did not plot exact locations because some datasets (e.g. species lists) cover a region and thus lack specific latitude/longitude locations. See Materials and methods for details and sources of the datasets. (Online version in colour.)

