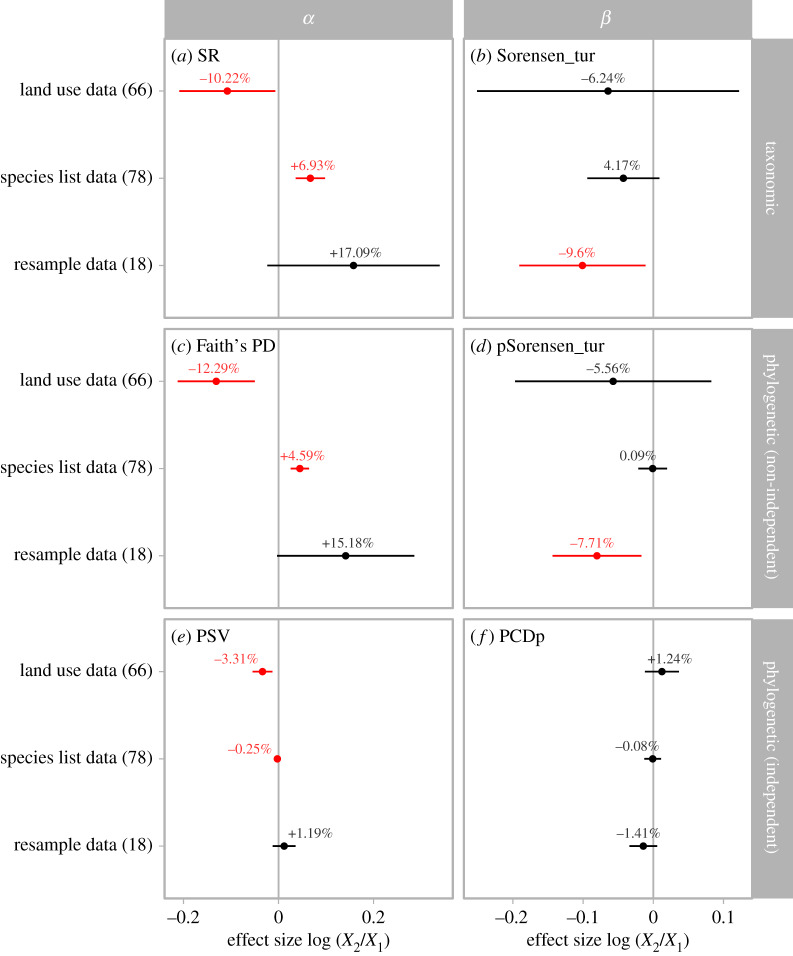
Figure 3.
Changes in biodiversity of different data types. (a) Changes in taxonomic α diversity measured as species richness; (b) pairwise taxonomic β diversity measured as the turnover component of Sorensen dissimilarity; (c) phylogenetic α diversity measured as Faith's PD; (d) pairwise phylogenetic β diversity measured as the turnover component of phylogenetic Sorensen dissimilarity; (e) phylogenetic α diversity measured as PSV; and (f) pairwise phylogenetic β diversity measured as the phylogenetic component of phylogenetic community dissimilarity. Error bars show mean and 95% confidence intervals based on linear mixed models, and are red if the confidence interval does not include zero. Positive effect sizes indicate increases in diversity. The numbers in parentheses denote the number of studies. For land use data, results here were derived from the land use gradient approach; see the electronic supplementary material, table S2 for results derived from the landscape approach. (Online version in colour.)

