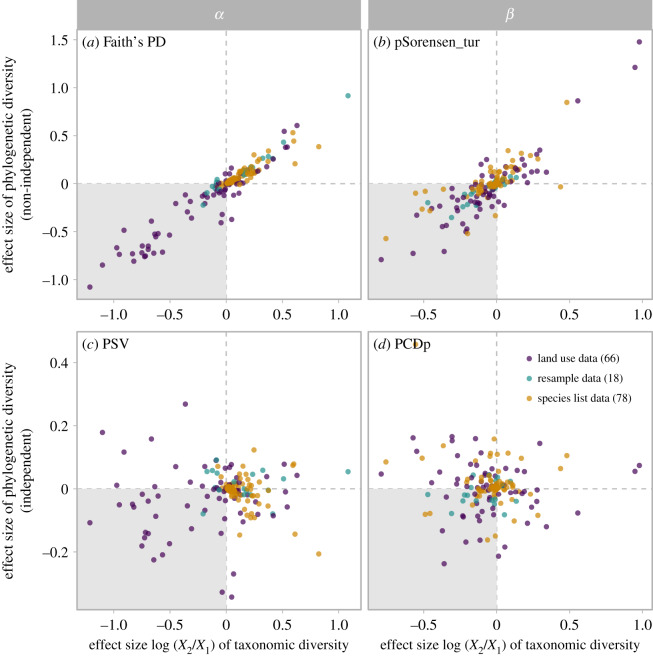
Figure 4.
Relationships between effect sizes of taxonomic diversity and phylogenetic diversity. (a) Phylogenetic α diversity measured as Faith's PD; (b) pairwise phylogenetic β diversity measured as the turnover component of phylogenetic Sorensen dissimilarity; (c) phylogenetic α diversity measured as PSV; and (d) pairwise phylogenetic β diversity measured as the phylogenetic component of phylogenetic community dissimilarity. The positive effect size suggests increases in diversity. Therefore, the grey area indicates decreases in both taxonomic diversity and phylogenetic diversity. Each dot represents the observed effect size for a dataset. Land use datasets consistently have reduced taxonomic α diversity. Most points in (b) and (d) are at the left side of the vertical line, suggesting taxonomic homogenization, a pattern confirmed by weighted linear mixed models. For land use data, results here were derived from the land use gradient approach. (Online version in colour.)

