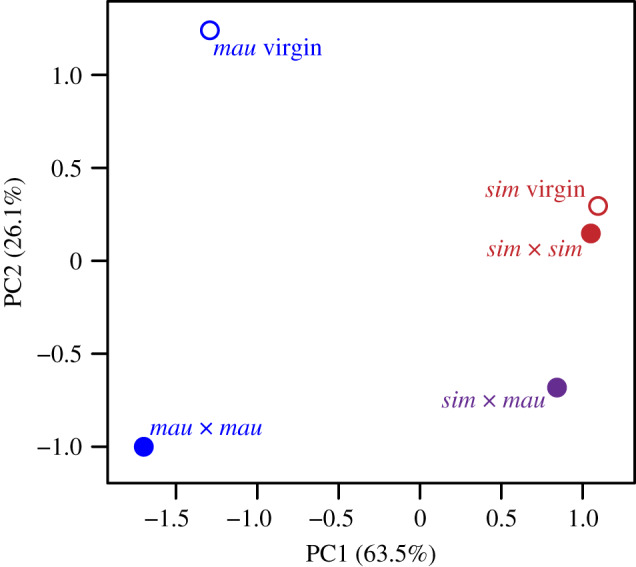
Figure 2.

Principal component analysis of FRT protein composition. The first two principal components explain nearly 90% of the variation in average protein abundances and are sufficient to separate conditions based on species (PC1) and mating status (PC2). (Online version in colour.)
