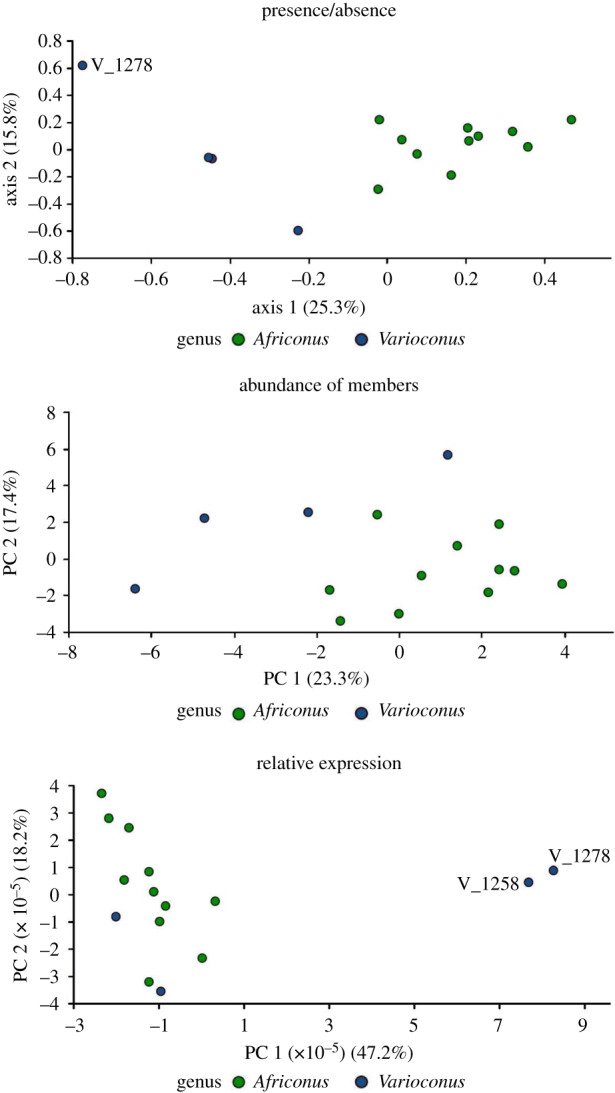
Figure 3.

MCA and PCA comparing venom compositions of genera Africonus and Varioconus. The two-dimensional scatter plots are shown. The venom composition was defined as presence/absence of conotoxin precursor superfamilies (a); superfamily conotoxin precursor abundance expressed as percentage over total number of members (b) and relative expression (TPM) levels (c). The percentages of the eigenvalue (MCA) or variance (PCA) for each of the axis are indicated on the corresponding labels. Extremes and outliers are labelled. (Online version in colour.)
