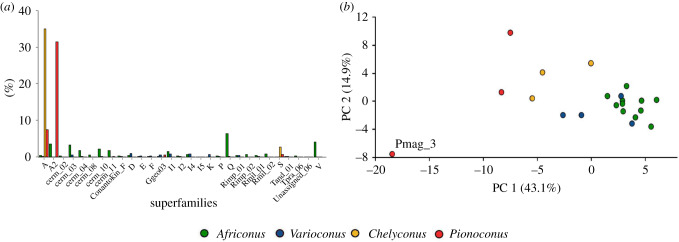
Figure 4.
Differences in venom compositions of vermivorous and piscivorous cones. (a) Average expression (measured in TPMs) of conotoxin precursor superfamilies per genus. Vermivorous genera (Africonus and Varioconus) were compared to piscivorous genera (Chelyconus and Pionoconus). The bar plot depicts those superfamilies differentially expressed between diets. (b) PCA comparing conotoxin precursor abundance per superfamily between vermivorous and piscivorous species. The percentages of variance for each of the axis are indicated on the corresponding labels. In both panels, the genera Africonus, Varioconus, Chelyconus and Pionoconus are depicted in green, blue, yellow and red, respectively.

