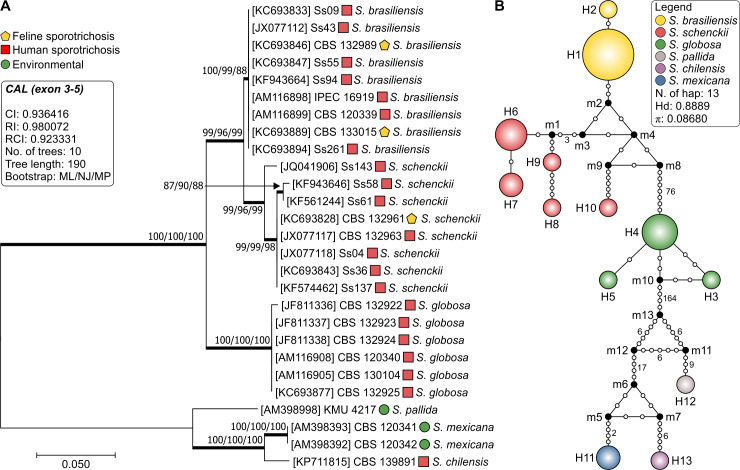
Fig 1.
Phylogenetic tree (A), inferred using the maximum likelihood method and Kimura 2-parameter model of the calmodulin sequences of 27 strains of Sporothrix. Numbers close to the branches represent ML/NJ/MP respectively. Bootstraps higher than 95 based on 1000 replications are represented in bold branches. Haplotype network of Sporothrix (B) was done using the median-joining method. The circumference size is proportional to the frequency of haplotype. The median vectors are displayed by black dots and represent hypothetical unsampled or extinct haplotypes in the population.

