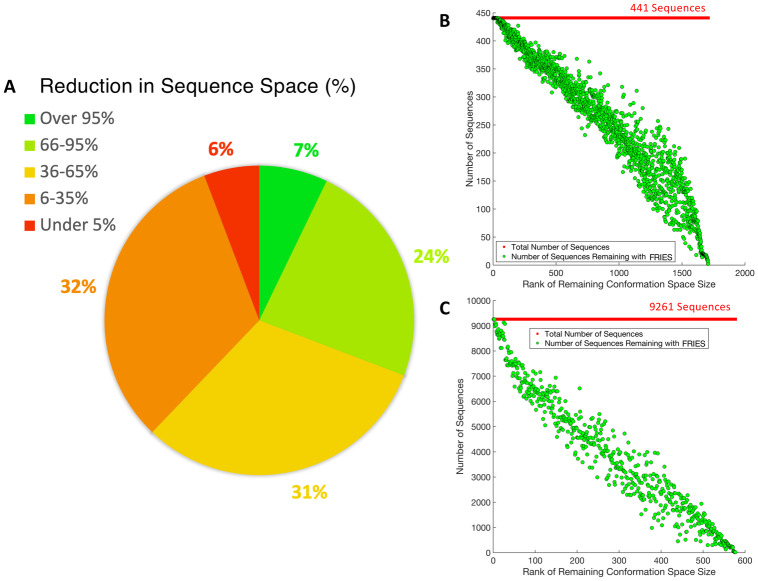
Fig 3. Reduction in input sequence space size using fries.
(A) A pie chart representing the reduction in the sequence space in percentages across all 2,662 designs. 7% of the designs had a reduction in sequence space over 95%, 24% of the designs had a reduction in sequence space between 66-95%, 31% of the designs had a reduction in sequence space between 36-65%, 32% of the designs had a reduction in sequence space between 6-35%, and 6% of the designs had a reduction in sequence space under 5%. (B) and (C) plot the number of sequences remaining after using fries starting with 441 and 9,261 sequences total, respectively. The number of sequences remaining for each design are sorted in order of decreasing size of the remaining conformation space after fries.

