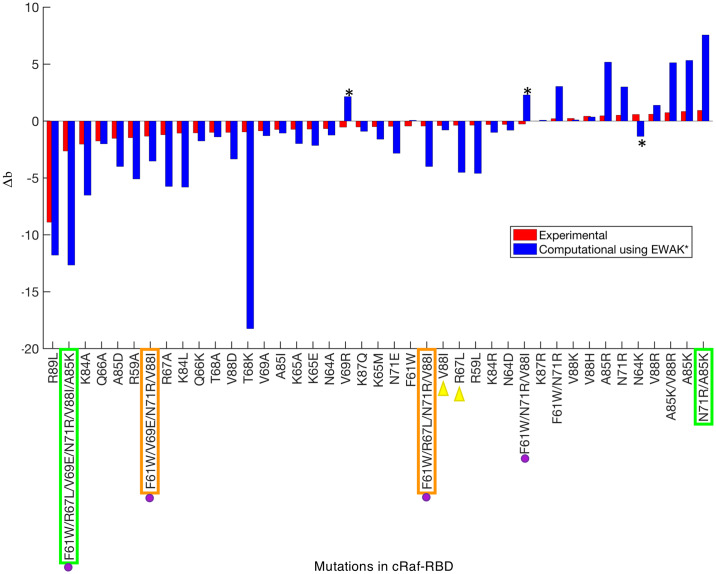
Fig 5. Predicting the effect of mutations in c-Raf-RBD on binding with KRas.
Each bar represents either the experimental (red) or computationally predicted (blue) effect each variant has on binding. The bars are sorted in increasing order of Δb value (see the Section entitled “fries/EWAK* retrospectively predicted the effect mutations in c-Raf-RBD have on binding to KRas”) of the experimental (red) bars. If the Δb value is less than 0, binding decreases. If the Δb value is greater than 0, binding increases. If the Δb value is close to 0, the effect is neutral. Quantitative values of K* tend to overestimate the biological effects of mutations (leading to the much larger blue bars) due to the limited nature of the input model compared to a biologically accurate representation. However, K* in general does a good job ranking variants, as can be seen here in Fig 6, in [1], and in [38]. Out of the 41 variants listed on the x-axis, only 3 were predicted incorrectly (marked with black asterisks) by EWAK*. In terms of accuracy, BBK* performed very similarly to EWAK*, however, in 2 cases (marked with green boxes), BBK* ran out of memory and was unable to calculate a score. BBK* also did not return values for the 2 variants marked with orange boxes. The variants marked with purple dots were tested in [60] experimentally—not computationally—and decreased binding of c-Raf-RBD to KRasGTP was observed, which EWAK* was able to predict correctly. The two variants marked with yellow triangles were computationally predicted in [60] to improve binding of c-Raf-RBD to KRasGTP. However, the experimental validation in [60] showed that these variants exhibit decreased binding, which EWAK* accurately predicted.

