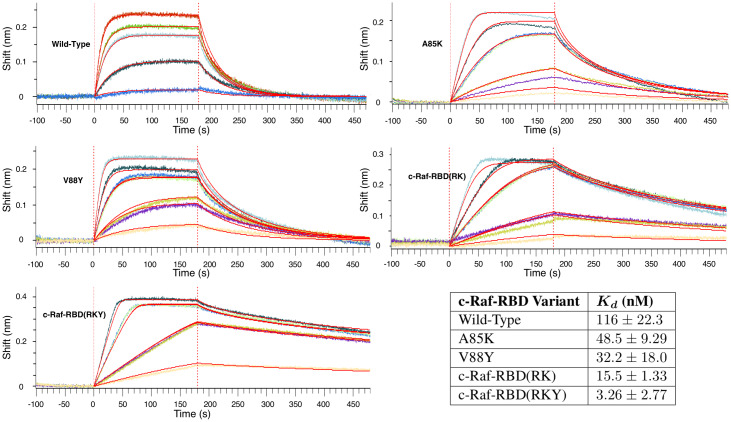
Fig 10. BLI titration experiments to calculate Kd values for select c-Raf-RBD variants. BLI titration experiments to calculate Kd values for select c-Raf-RBD variants.
The plots shown here are representative and the data from replicate experiments is presented in S4 Table along with curves in S2 and S3 Figures. Each plot shows the data collected from a titration BLI experiment where the concentration of the c-Raf-RBD variant is incrementally increased. The concentrations for the wild-type variant were 10, 50, 150, 200, and 300 nM. The concentrations for all of the other variants were 10, 25, 25, 75, 75, 125, and 200 nM. Repeat intermediate concentrations were used as loading controls. These curves were then fit using a mass transport model within the Octet Data Analysis HT software provided by FortéBio in order to calculate the Kd value for each variant’s binding to KRas. The values in the table here (bottom right) are average Kd values shown with 2 standard deviations calculated from replicate experiments (see S4 Table, S2 and S3 Figures). The values presented here for wild-type, A85K, and c-Raf-RBD(RK) agree well with previously reported Kd values [60]. The best binding variant, c-Raf-RBD(RKY), binds to KRas about 5 times better than the previous tightest-known binder, c-Raf-RBD(RK), and about 36 times better than the design starting point, wild-type c-Raf-RBD.

