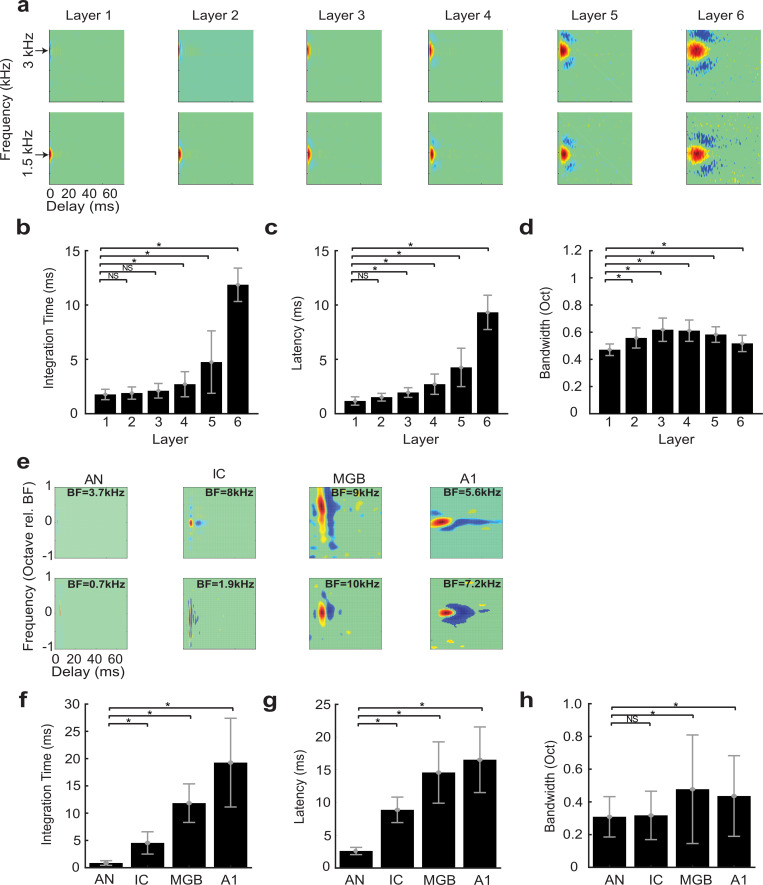
Fig 3. Receptive field transformations of the optimal HSNN predicts transformations observed along the ascending auditory pathway.
(a) Example spectro-temporal receptive field (STRF) measured for the optimal network change systematically between consecutive network layers. All STRFs are normalized to the same color scale (red = increase in activity or excitation; blue = decrease in activity or inhibition/suppression; green tones = lack of activity). In the early network layers STRFs are relatively fast with short duration and latencies, and relatively narrowly tuned. STRFs become progressively slower, slightly broader, and have longer patterns of inhibition across the network layers, mirroring changes in spectral and temporal selectivity observed in the ascending auditory pathway. The measured (b) integration times, (c) latencies, and (d) bandwidths increase across the six network layers. (e) Examples STRFs from the auditory nerve (AN) [26], inferior colliculus (IC) [7], thalamus (MGB) and primary auditory cortex (A1) [8] become progressively longer and have progressively more complex spectro-temporal sensitivity along the ascending auditory pathway. Average integration times (f), latencies (g) and bandwidths (h) between AN and A1 follow similar trends as the optimal HSNN (b-d). Asterisks (*) designate significant comparisons (t-test with Bonferroni correction, p<0.01) relative to layer 1 for the optimal network (b-d) or relative to the auditory nerve for the neural data (f-h) while error bars designate SD.

