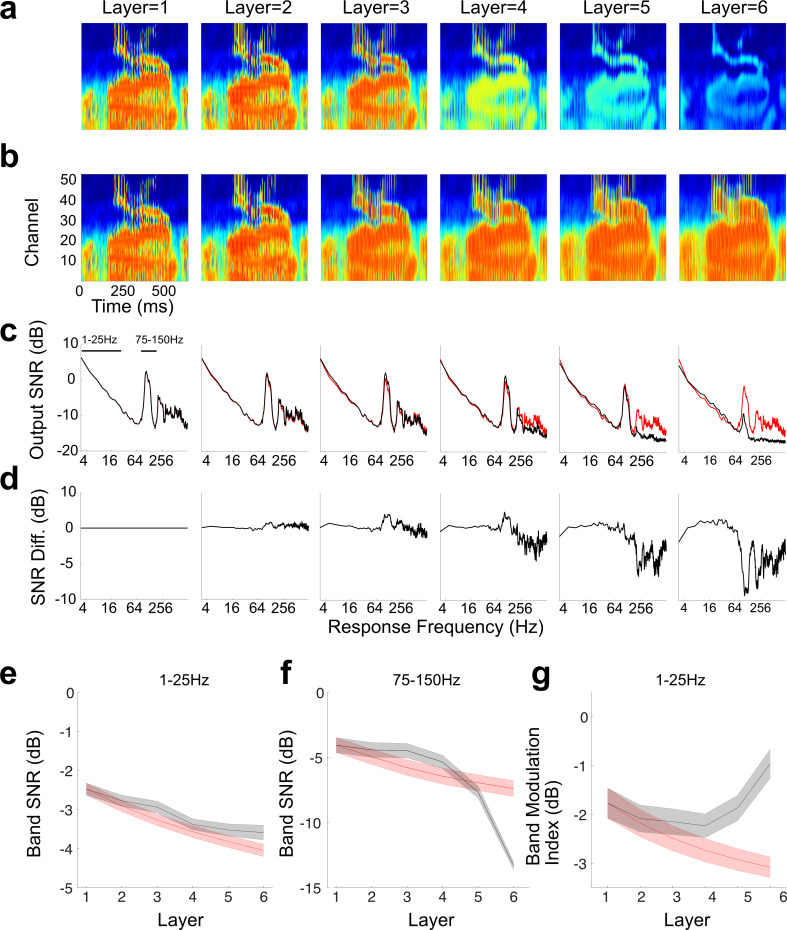
Fig 7. Hierarchical transformation between consecutive network layers of the optimal HSNN serve to denoise the speech signal and selectively enhance word related temporal information.
The average network outputs are shown for the word zero (over 50 trials) at different layers of the optimal (a) and high-resolution networks (b). The response signal-to-noise ratio (SNR) remains relatively consistent for the high-resolution network across layers (c, red curve). By comparison, for the optimal network the response is sequentially lowpass filtered so that the response SNR is sequentially reduced across layers for high modulation frequencies (c, black curve). (d) The difference SNR (optimal–high res, black–red curve in panels b) demonstrate a sequential lowpass filtering that accumulates across layers for the optimal HSNN. The band SNR within the fluctuation/rhythm range (1–25 Hz) decreases with layer, but is slightly enhanced for the optimal network (e, black curve) when compared to the high-resolution network (e, red curve). The band SNR within the periodicity pitch range (75–150 Hz) is substantially reduced across layers of the optimal network (f, black) when compared to the high-resolution network (f, red). The modulation index within the 1–25 Hz band increases and is thus enhanced across layers of the optimal network (g, black) whereas it is reduced for the high-resolution network (g, red). Error bars in panels e-g represent SEM.

