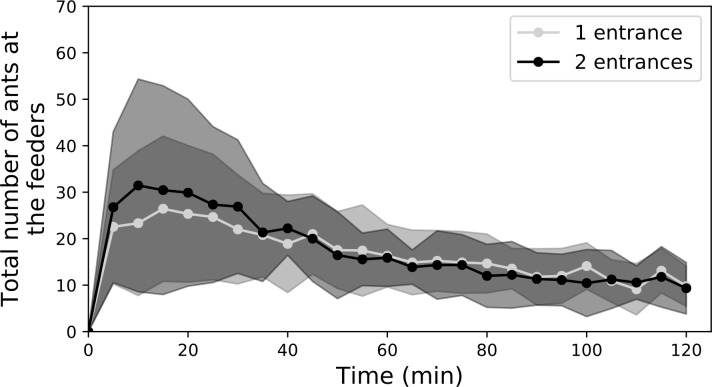
Fig 3. Dynamics of the total number of ants at the two feeders.
The number of ants at each feeder was measured every five minutes over the course of the experiment, for one-entrance nests and two-entrance nests (in grey and black respectively). Circles and shadings represent the mean±SD, respectively (n = 9).

