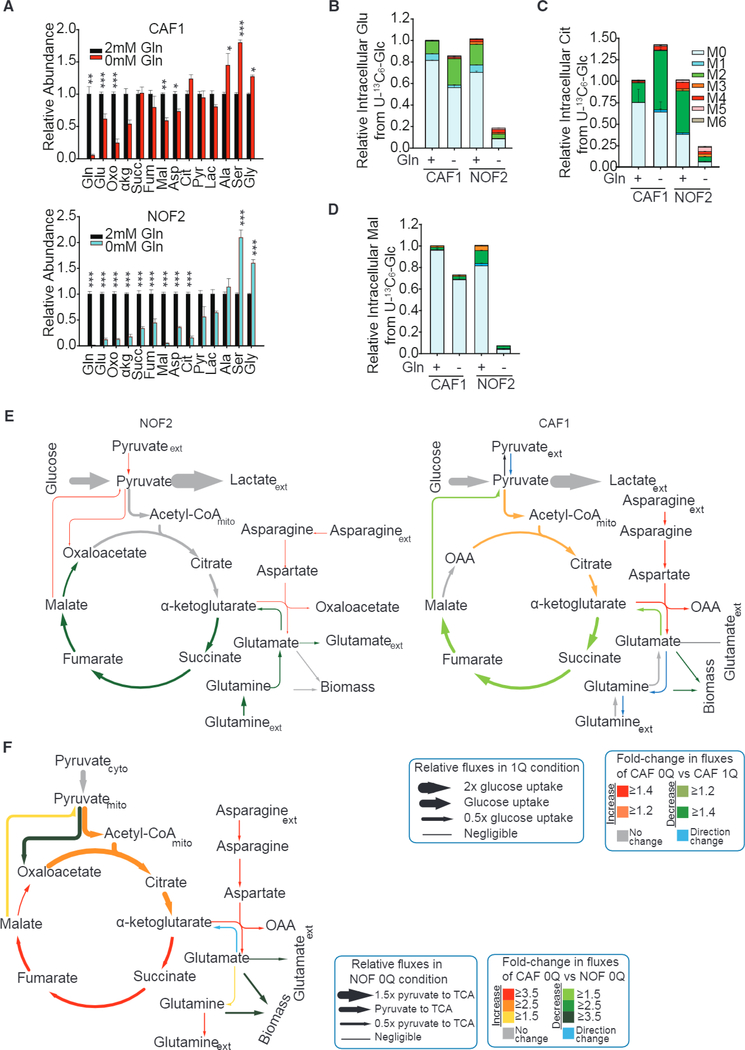
Figure 2. Upregulated Asparagine and Aspartate Flux through GOT in CAFs Promote Gln Synthesis.
(A) Intracellular concentrations of metabolites in CAFs and NOFs under Gln deprivation relative to nutrient-rich medium.
(B-D) Fractional enrichments of glutamate (B), citrate (C), and malate (D) in CAF1 and NOF2 cultured with U-13C6 glucose under Gln-replete condition or Gln starvation.
(E) Intracellular fluxes in Gln-deprived NOF/CAF (NOF/CAF 0Q) relative to NOF/CAF in nutrient-rich medium (NOF/CAF1Q) quantified using U-13C6 glucose tracer experiments and 13C metabolic flux analysis. Line thickness is proportional to flux values in CAF 1Q conditions. Color key represents increased (red) or decreased (green) fluxes in conditions compared to control. Blue arrows represent fluxes that are reversed in the condition compared to control, and gray arrows represent no significant change in fluxes between conditions.
(F) Intracellular fluxes in Gln-deprived CAFs (CAF 0Q) relative to Gln-deprived NOFs (NOF 0Q) quantified using U-13C6 glucose tracer experiments and 13C metabolic flux analysis (13C-MFA). Line thickness is proportional to flux values (relative to pyruvate flux to TCA) in NOF 0Q conditions. Confidence intervals for 13C-MFA fluxes estimated using Monte-Carlo sampling are reported in Tables S2-S4.
Error bars indicate mean ± SEM of n ≥ 3 independent experiments. *p < 0.05, **p < 0.01, ***p < 0.001.

