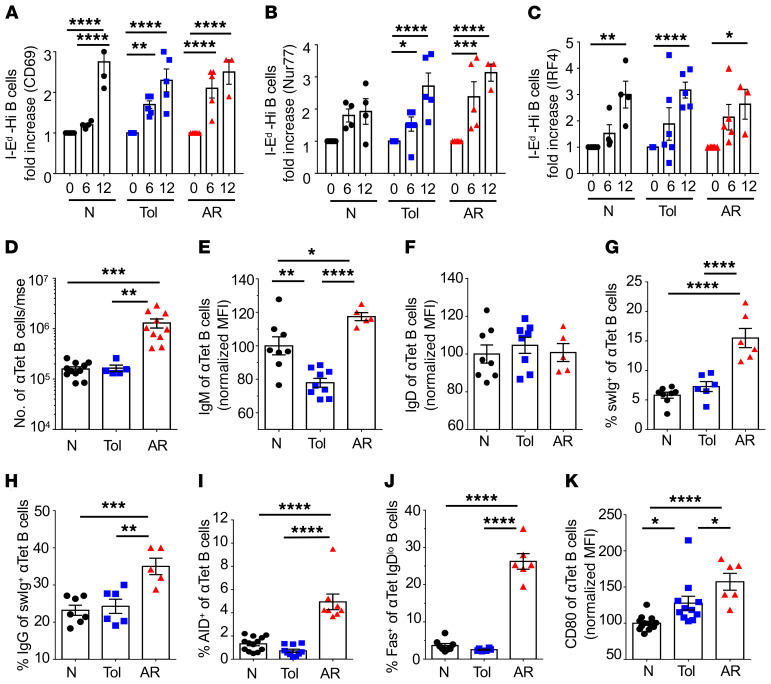
Figure 2. Alloreactive B cells in tolerant recipients express early activation markers but do not differentiate into germinal center B cells.
Fold increase in the percentage of early activation markers (A) CD69, (B) Nur77, and (C) IRF4, after coculture with immobilized I-Ed tetramer for 6 or 12 hours. B cells that bound to I-Ed tetramer with high MFI were sorted from naive (N), tolerant (Tol) (day ≥30 after HTx), and AR (days 10–14 after HTx) mice. n = 4–6/group. Data were normalized to unstimulated I-Ed tetramer–negative B cells cultured for 6 or 12 hours. (D) Total number of donor-specific (anti-Kd [αKd], αLd, and αI-Ed) B cells/mouse (mse). n = 5–11/group. (E) IgM expression of anti-tetramer (αTet) B cells. n = 5–9/group. (F) IgD of αTet B cells. n = 5–8/group. (G) Percentage switched immunoglobulin–positive (swIg+) of αTet B cells. n = 6–8/group. (H) Percentage IgG of swIg+ αTet B cells. n = 5–7/group. (I) Percentage AID+ of αTet B cells. n = 8–13/group. (J) Percentage Fas+ of αTet IgDlo B cells. n = 6–8/group. (K) CD80 expression on αTet B cells (n = 6–13/group) in naive, tolerant, and AR mice. MFIs were normalized to naive control mice. Each symbol represents an individual mouse, pooled from 2 or more independent experiments. Data are presented as the mean ± SEM. *P < 0.05; **P < 0.01; ***P < 0.001; ****P < 0.0001 by 1-way ANOVA with Bonferroni’s post hoc test.

