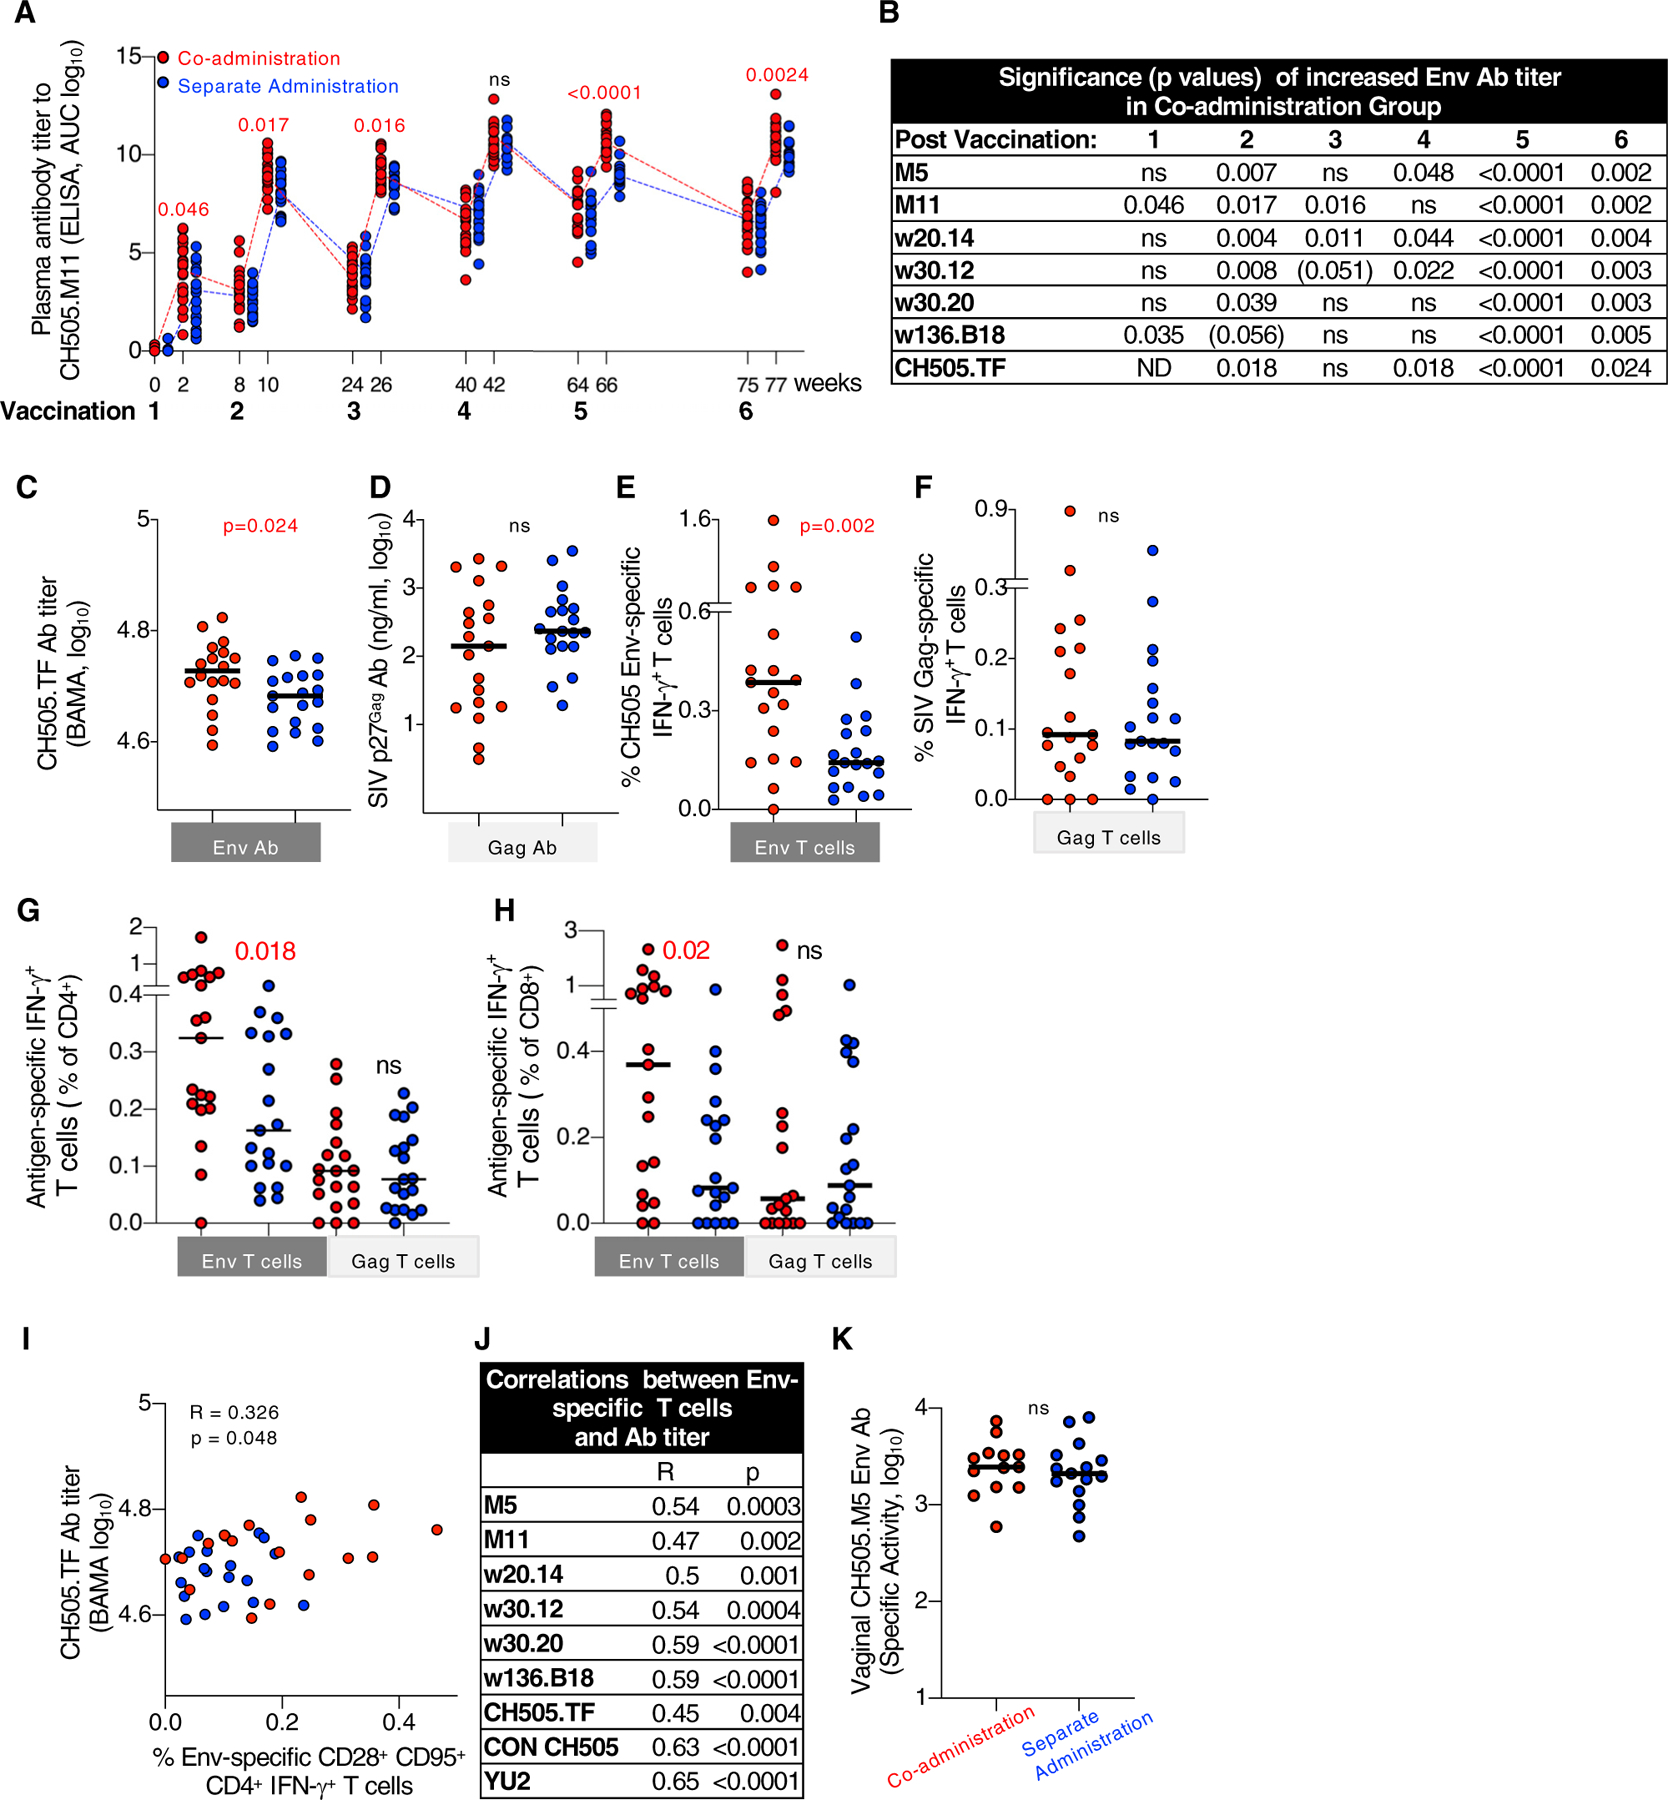
Figure 2. Co-administration Regimen Induced Higher Env Immune Responses.

(A) Kinetics of vaccine-induced CH505.M11 Env antibodies (Abs) were measured by ELISA and Env Ab titers of individual RMs are shown as area under the curve (AUC) at the time of vaccination and 2 weeks later. Red symbols, co-administration group; blue symbols, separate administration vaccine group. Red numbers indicate p values showing significant higher values measured in the co-administration group.
(B) Summary of the differences in Env Ab titers measured after each vaccination against a panel of CH505 gp120 proteins. p values denote statistically significant higher values in the co-administration group; p values (p = 0.051- < 0.06) indicate trend; ns, not significant. ND, not determined.
(C–F) Comparison of HIV Env and SIV Gag Abs and T cell responses between the vaccine groups after the last vaccination.
(C and D) Ab responses measured to (C) HIV CH505.TF gp120 Env and (D) SIV Gag.
(E and F) T cell responses (% antigen-specific IFN-γ+) measured with peptides covering (E) all CH505 gp145 Env proteins used in the vaccine (F) SIV p57Gag. Similar data were obtained from samples analyzed after fifth vaccination.
(G and H) Antigen-specific IFN-γ+ T cells are presented as a percentange of CD4+ (G) and CD8+ (H) T cell subsets.
(I and J) Direct correlation between the CH505 Env-specific CM-like CD4+ IFN-γ+ T cells (presented as a percentage of the CD3+ cells) and (I) CH505.TF Ab levels after sixth vaccination and (J) summary of correlations with different Env Abs after fifth vaccination. R and p values (Spearman) are given.
(K) Abs to CH505.M5 Env were measured in vaginal secretion after vaccination 6. Values are presented as specific binding activity (SA) and were calculated as mean fluorescence intensity (MFI) 3 dilution/total IgG concentration (micrograms per milliliter). p values (Mann-Whitney test) are given for all comparisons.
