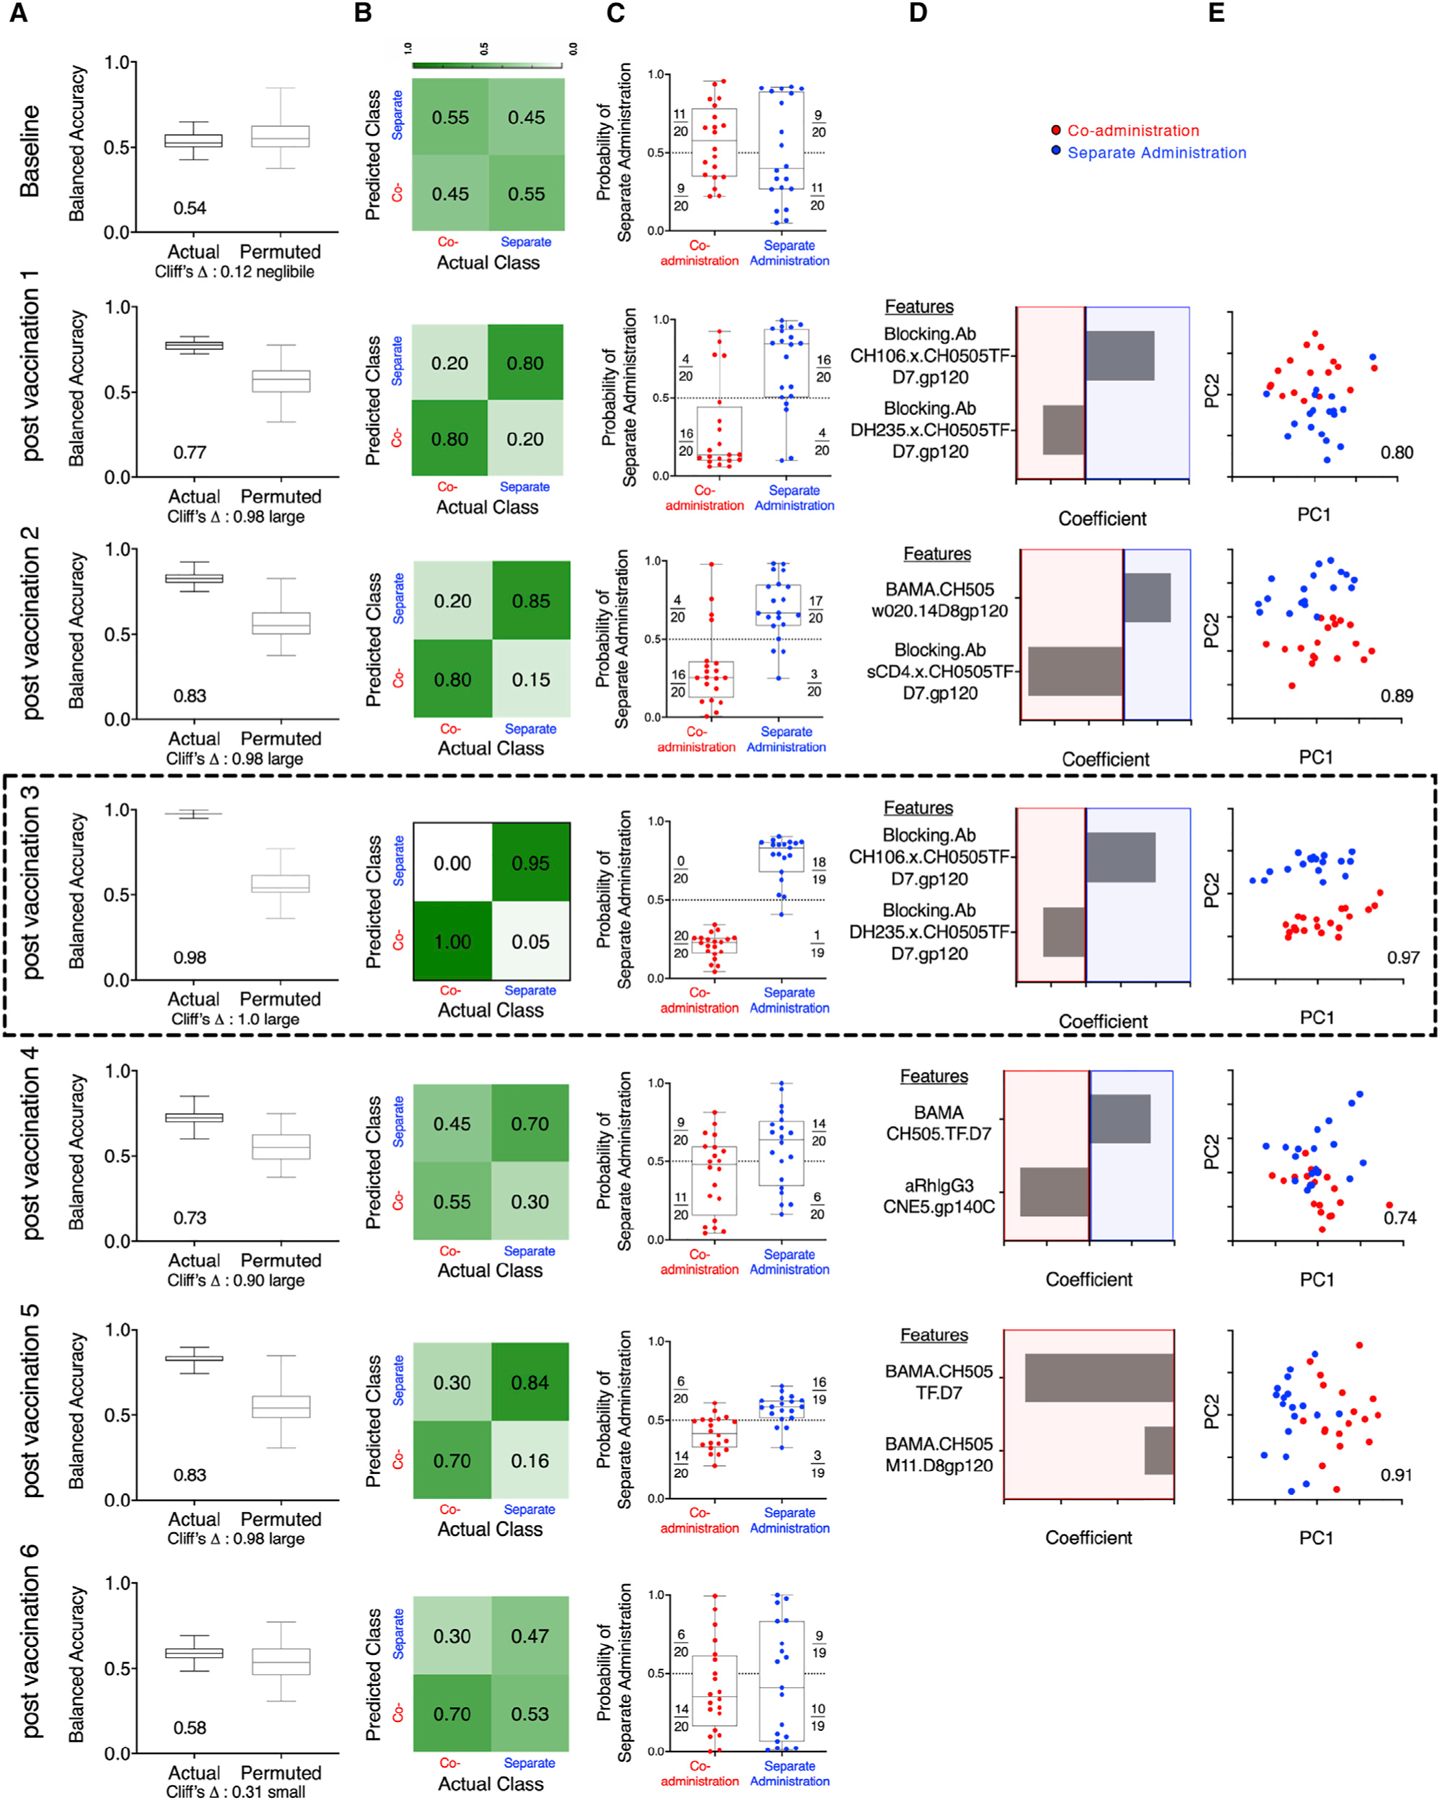
Figure 4. Immunogenicity Profiles Robustly Distinguishes Animals Vaccinated with the Co-administration and Separate Administration Vaccine Regimens.

(A) Balanced accuracy of models learned on training data when applied to test data across 100 replicates of 10-fold cross validation. Models learned from actual data (left) perform substantially better (Cliff’s delta, 1.0) than those learned from permuted data (right). Average accuracy across cross-validation runs is reported in inset.
(B) Confusion matrix depicting the proportion of animals in each study arm predicted correctly/incorrectly.
(C) Model confidence, defined by probability of belonging to the separate side class. Dotted line indicates the decision boundary.
(D) Feature contributions to the simplified final model.
(E) Principal-component (PC) biplot of features contributing to the simplified final model. Simplified model accuracy is reported in inset. Animals are represented as dots, with color indicating vaccine arm. Classification performance over time could not be strictly compared, as different immunogenicity tests were performed at different time points, and in some cases, samples from all macaques were not available for all time points for all tests (Table S2). Simplified forms of the final models learned on one time point were applied to data from other time points and demonstrated good consistency in defining signatures of group-specific immunogenicity that were robust across longitudinal time points during the immunizations (Table S5). The data from the analysis performed after third vaccination showing peak accuracy is shown boxed.
