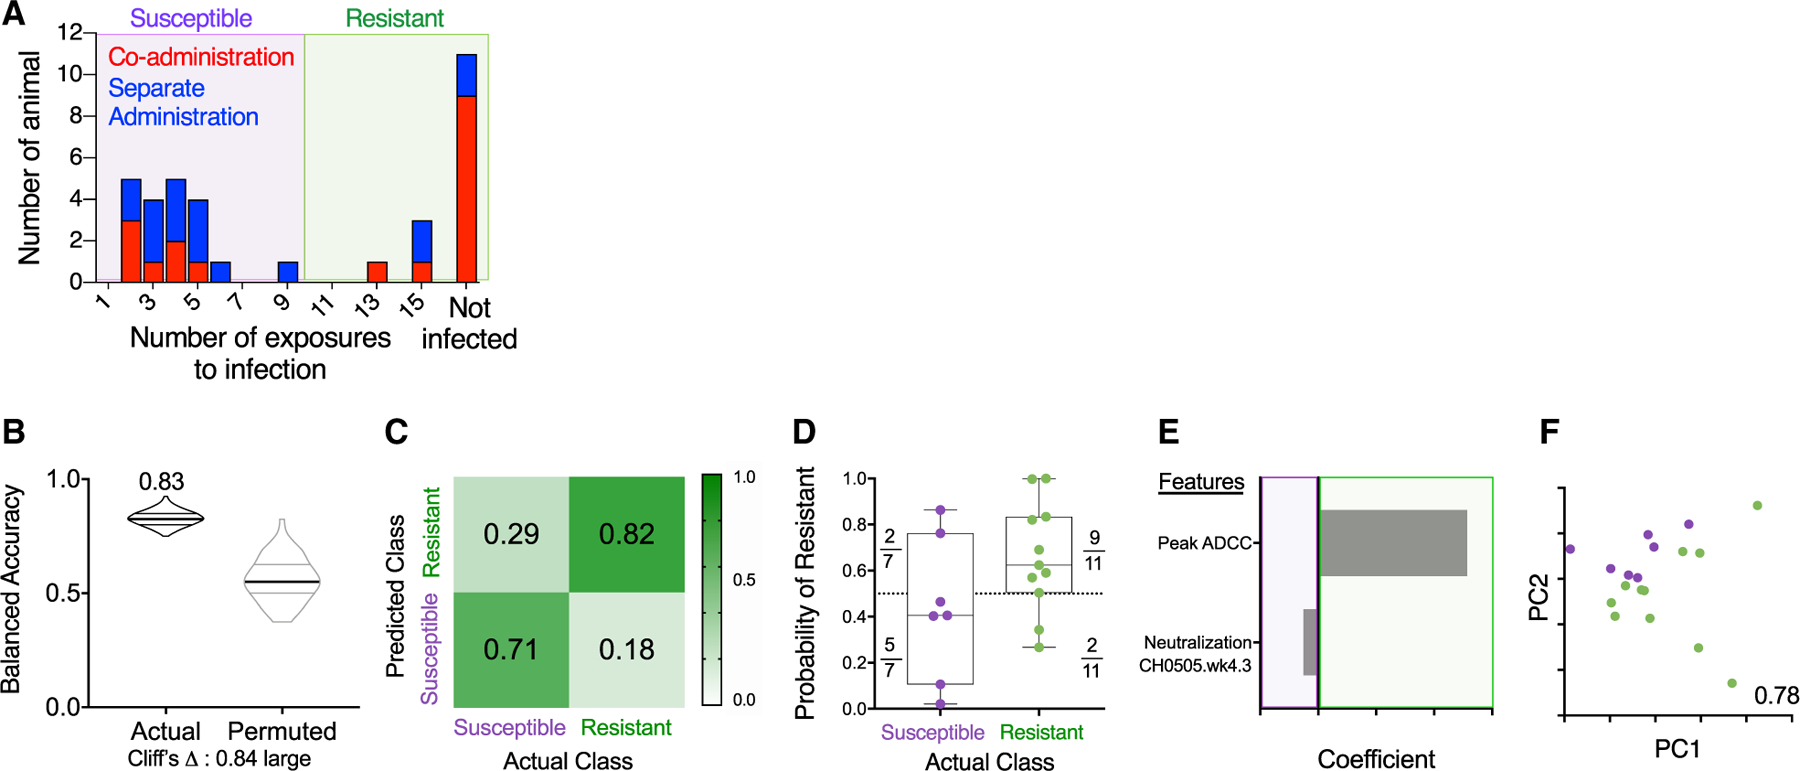
Figure 5. Immune Response Profiles Robustly Distinguish Resistant Animals in the Co-administration Group.

(A) Histogram of challenge outcomes for all RMs with sensitive and resistant animals defined as those infected (purple box) or not infected (green box) prior to the 10th challenge.
(B–F) Models of infection resistance learned from immunogenicity data post-third immunization for the co-administration group. A classifier was trained to use immunogenicity data to distinguish between animals based on challenge resistance.
(B) Balanced accuracy of models learned on training data when applied to test data. Models learned from actual data (left) perform substantially better (Cliff’s delta, 0.84) than those learned from permuted data (right). Robust performance and good overall average accuracy (83%) in the setting of repeated cross validation was achieved.
(C) Confusion matrix depicting the proportion of animals in each study arm predicted correctly/incorrectly.
(D) Model confidence defined by probability of belonging to the assigned class.
(E and F) A final model was trained on the complete data and simplified to a sparse, two-feature model.
(E) Coefficients of features in the simplified final model.
(F) PC biplot of features contributing to the simplified final model with accuracy reported in inset. Resistant RMs are indicated in green; susceptible RMs are indicated in purple.
