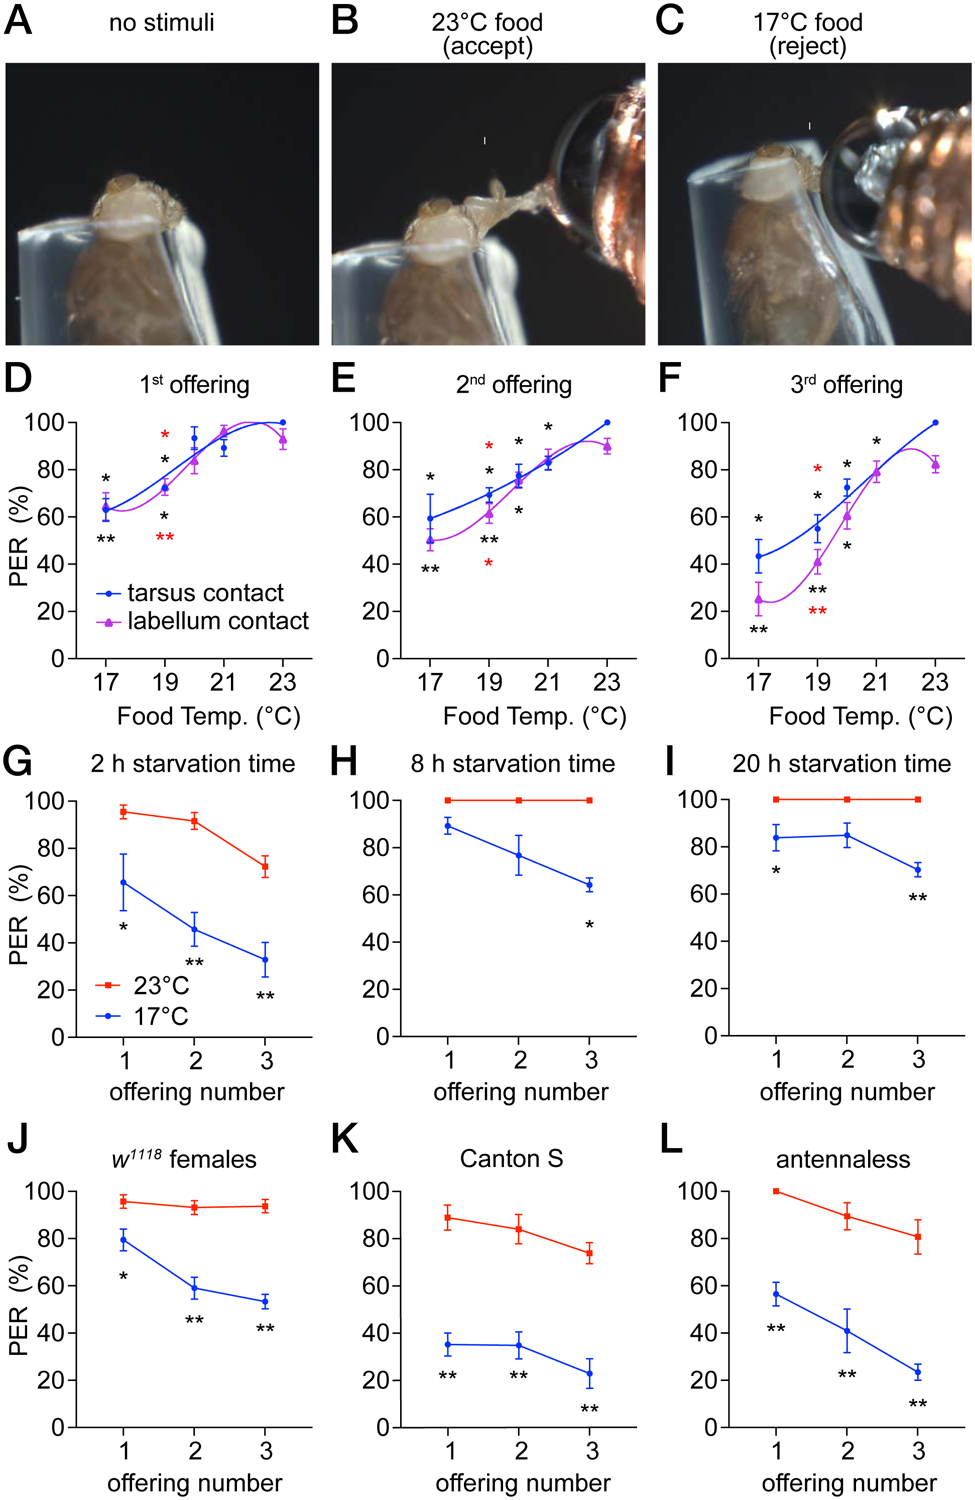
Figure 1. Reduced attraction to cool food.

PER assays using control (w1118) males. The animals were starved for 2 hours unless indicated otherwise. All PER analyses in this study were performed by stimulating the labellum, except for the indicated experiments in D—F that were performed by stimulating tarsi.
(A—C) A fly immobilized in a pipet tip was stimulated on the labellum with a drop of 0.5 M sucrose at the indicated temperature, using a temperature-controlled probe. Figure S1.
(A) Prior to presentation of a food stimulus.
(B) Fly extending its proboscis (arrow) upon stimulation with 23°C sucrose. Video S1.
(C) Fly rejecting sucrose at 17°C. Video S2.
(D—F) PER assays using 0.5 M sucrose at 17° to 23°C. Flies were offered food three consecutive times either on the tarsi (blue) or the labellum (purple). The interval between offerings was 1 minute. A third order polynomial (cubic) equation was used to interpolate the fit curve. Asterisks indicate significant differences between flies stimulated at 23°C (black) or 21°C (red). The labella and tarsi responses were analyzed separately. n=5 trials.
(D) 1st offering.
(E) 2nd offering.
(F) 3rd offering.
(G—I) PER assays to test for impacts of starvation time on cool-induced suppression of attraction to 0.5 M sucrose. Food was offered at either 17°C (blue) or 23°C (red). n=4–5 trials.
(G) 2 hours starvation.
(H) 8 hours starvation.
(I) 20 hours starvation.
(J—L) PER assays testing the effects of sex, the control strain or the antenna on cool-induced suppression of attraction to 0.5 M sucrose. Food was offered at either 17°C (blue) or 23°C (red). We made pairwise comparisons between the 17° and 23° 1st, 2nd, 3rd offerings. Asterisks indicate significant differences between each pair of data.
(J) Females. n=5 trials.
(K) Canton S. n=5 trials.
(L) Antennaless flies. n=6 trials.
Each dot and error bar represents means ±SEM. Each trial includes ≥8 flies. *P<0.05, **P<0.01, nonparametric Mann-Whitney test.
