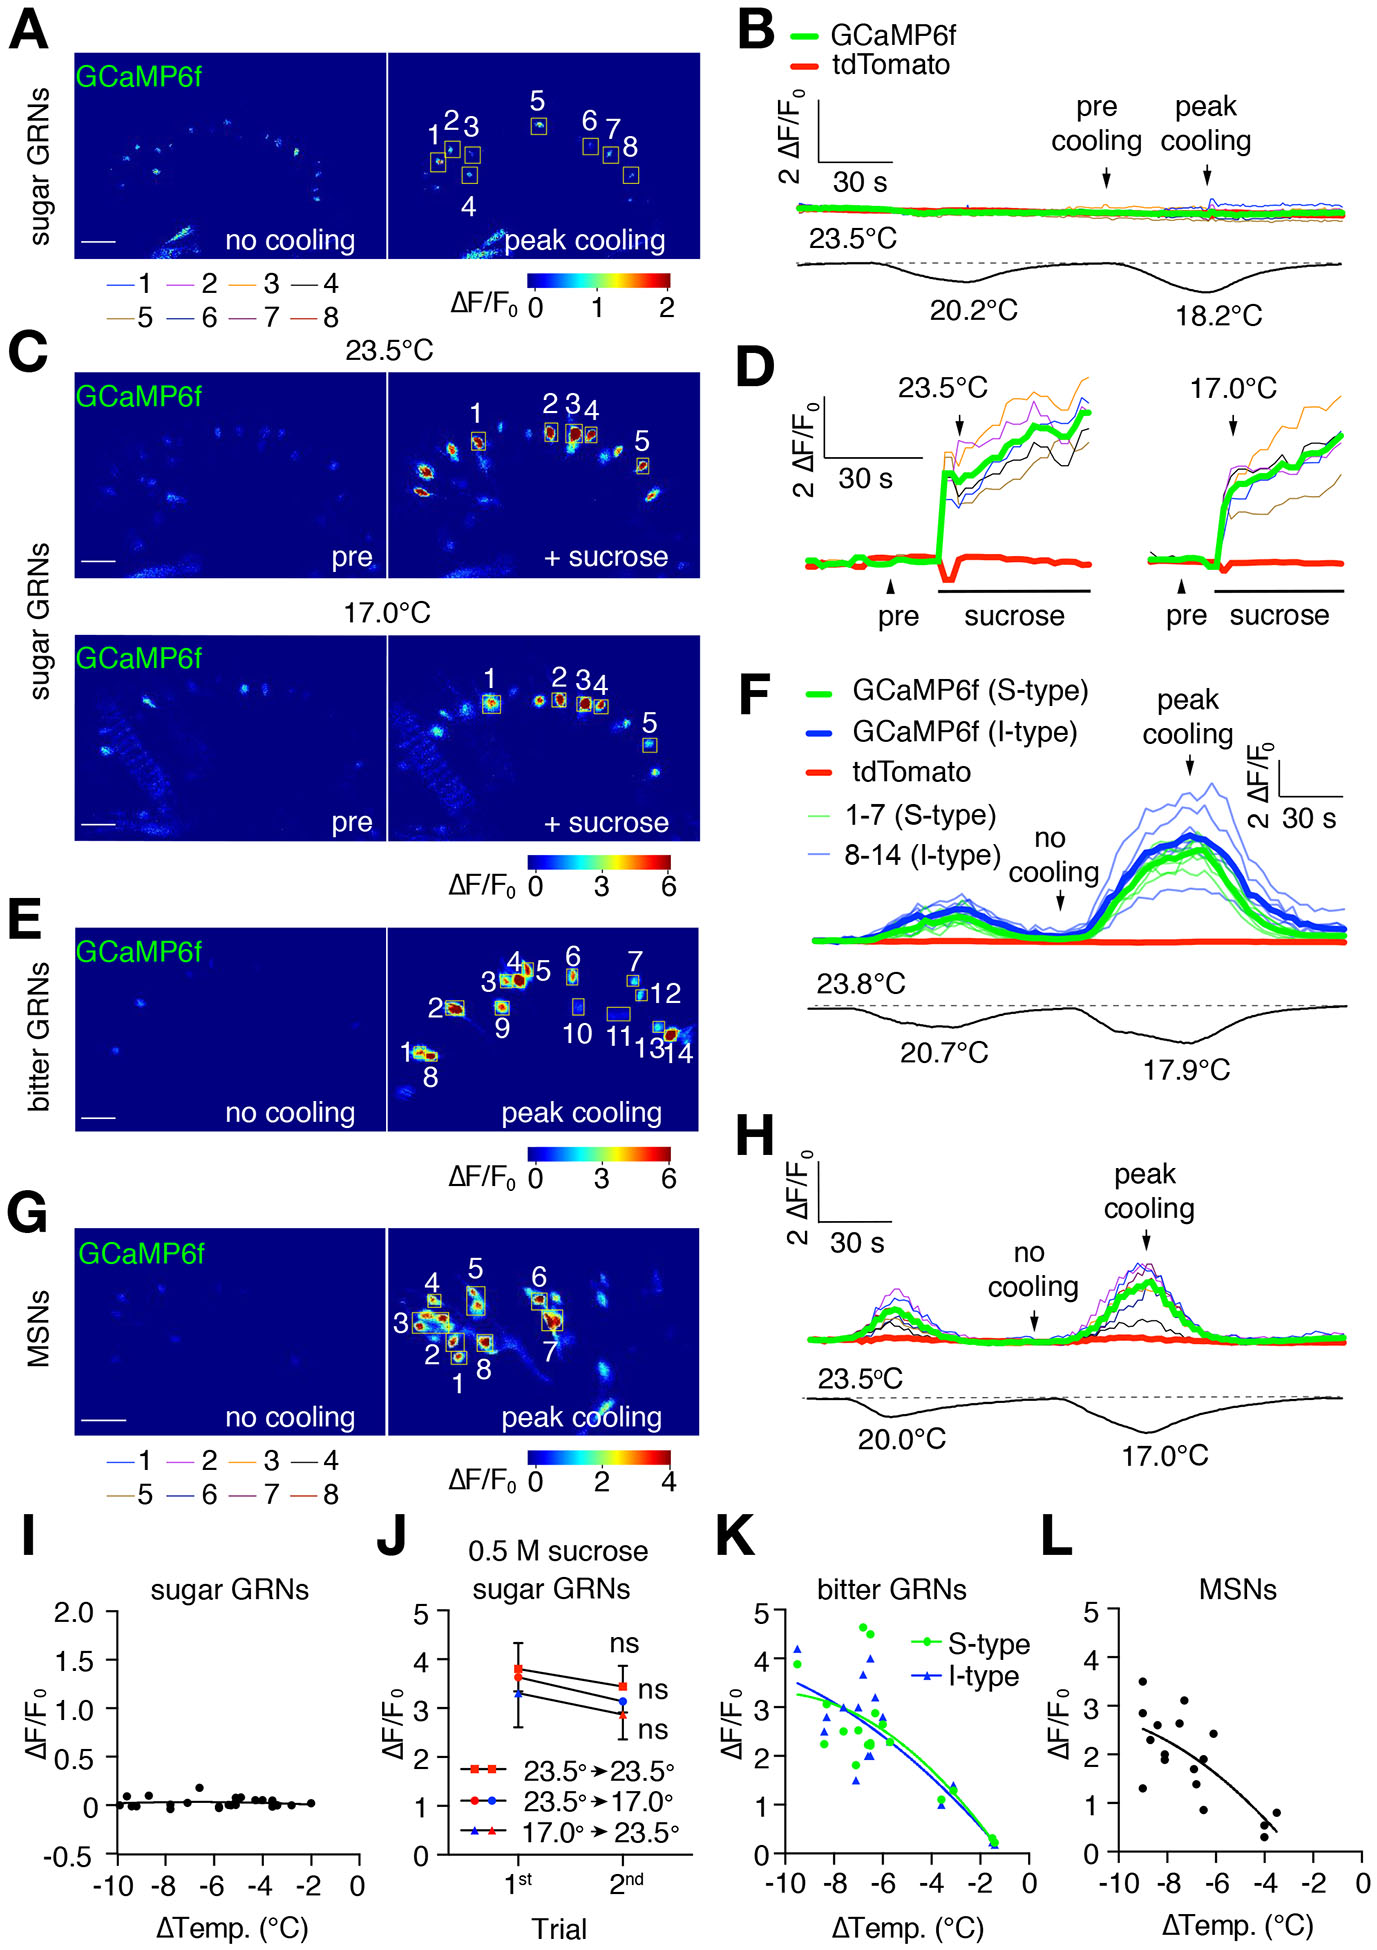
Figure 2. Cooling increases Ca2+ responses in bitter GRNs and MSNs.

Changes in GCaMP6f fluorescence (ΔF/F0) in different classes of neurons in the labellum in response to cooling. UAS-GCaMP6f/+ was expressed under the control of the indicated Gal4 drivers. UAS-tdTomato/+ was co-expressed in the same neurons to serve as a baseline control (see Figure S2 for tdTomato signals). Scale bars in A, C, E, and G represent 20 μm. The regions of interest (ROI) were cells that remained in focus during the entire imaging sequence. See Figures S7D and S7E for setup.
(A, B) GCaMP6f fluorescence (ΔF/F0) in sugar GRNs during cooling. UAS-GCaMP6f/+ and UAS-tdTomato/+ were expressed using the Gr64f-Gal4. Video S3.
(A) GCaMP6f fluorescence (ΔF/F0) prior to cooling and during peak cooling (23.5° and 18.2°C, respectively; left and right panels, respectively). Boxed GRNs are ROI. The cooling regime is shown in (B). A ΔF/F0 color scale is shown.
(B) Traces showing GCaMP6f responses (ΔF/F0) of sugar GRNs to cool temperature stimuli, indicated by the lower temperature trace. Colored thin traces represent each of the 8 sugar GRNs (ROI) indicated in (A). Bold red and green traces denote the average tdTomato and GCaMP6f fluorescence of all cells within the ROI.
(C, D) Cool temperature (e.g. 17°C) does not suppress sucrose-induced GCaMP6f responses in sweet GRNs in the labellum. UAS-GCaMP6f/+ was expressed under control of the Gr64f-Gal4. 0.5 M sucrose was used to stimulate the same labellum at 25°C and 17.0°C. Between the two sucrose applications, the sugar was washed out and the temperature was adjusted. The interval between sucrose applications was 5—10 min. Video S4 for presentation of sucrose at 23° and 17°C. Video S5 for response of sweet GRNs stimulated with sucrose during a cool temperature ramp.
(C) GCaMP6f fluorescence (ΔF/F0) in sugar GRNs 5 sec before (pre) and 5 sec after adding sucrose (+ sucrose) to the same labellum at 23.5°C (top two panels) and at 17.0°C (bottom two panels). The boxed sugar GRNs are ROI. A ΔF/F0 color scale is shown. Some shifting in the orientation of the labellum occurred during the washout of the 23.5°C sucrose. The GRNs (1–5) responding to 17.0°C are the same as those responding to 23.5°C.
(D) Traces showing the GCaMP6f responses (ΔF/F0) to sugar at either 23.5° or 17.0°C. The colored thin traces represent each single sugar GRN (ROI) indicated in (C). The bold red and green bold traces indicate the average tdTomato and GCaMP6f fluorescence.
(E—H) GCaMP6f responses (ΔF/F0) of bitter GRNs and MSNs to cooling. UAS-GCaMP6f/+ and UAS-tdTomato/+ were expressed in bitter neurons and MSNs under control of the: (E, F) Gr66a-Gal4/+, and (G, H) R41E11-Gal4/+. Video S6.
(E) GCaMP6f fluorescence exhibited by bitter GRNs in the absence of cooling (left panel, no cooling, 23.8°C) and during peak cooling (right panel, 17.9°C). The boxed regions in the right panel are the ROI. Cells 1—7 are S-type bitter GRNs, and cells 8—14 are I-type bitter GRNs. The cooling regime is shown in (F). A ΔF/F0 color scale is shown.
(F) Traces showing GCaMP6f responses of bitter GRNs in the presence and absence of cooling. The lower trace displays the temperature changes during the recordings. The colored thin traces represent each single GRN (ROI) indicated in (E). The bold green and blue traces indicate the average GCaMP6f fluorescence in S and I type bitter GRNs respectively, while the bold red trace indicates the average tdTomato fluorescence.
(G) GCaMP6f fluorescence exhibited by MSNs in the absence of cooling (no cooling, 23.5°C; left panel) and during peak cooling (17.0°C; right panel). The boxed regions in the right panel indicate ROI. The cooling regime is shown in (H). A ΔF/F0 color scale is shown. Video S7.
(H) Traces showing GCaMP6f responses of MSNs in the presence and absence of cooling. The lower trace displays the temperature changes during the recordings. The colored thin traces represent each MSN (ROI) indicated in (G). The bold red and green bold traces indicate the average tdTomato and GCaMP6f fluorescence.
(I) Scatter plot of GCaMP6f fluorescence displayed by sugar GRNs to cooling in the absence of sucrose. Each dot represents the average maximum ΔF/F0 from all the GCaMP6f-positive cells in the field following cooling (−2° to −10°C) from the initial temperature of 23°—24°C. Each dot represents the average maximum ΔF/F0 from during one trial at a given temperature. Each sample was subjected to no more than 3 trials. n=14 animals.
(J) GCaMP6f responses (ΔF/F0) of sugar GRNs upon exposure to two consecutive ~40 sec stimulations with 0.5 M sucrose at the indicated temperatures. There were no statistically significant differences between any two consecutive stimuli. Error bars represent means ±SEMs. n=5 animals, nonparametric Mann-Whitney test. ns, not significant. See Figure S3 for dtTomato controls.
(K) Scatter plot of GCaMP6f responses of S- and I-type bitter GRNs to cooling. Each dot represents the average maximum ΔF/F0 from all of the GCaMP6f-positive cells in the field following cooling (−2° to −10°C) from the initial temperature of 23°—24°C. Each dot represents the average maximum ΔF/F0 during one trial at a given temperature. Each sample was subjected to a maximum of 3 rounds of cooling. n=7 animals.
(L) Scatter plot of GCaMP6f responses of mechanosensory neurons to cooling. Each dot represents the average maximum ΔF/F0 from all of the GCaMP6f-positive cells in the field following cooling (−2° to −10°C) from the initial temperature of 23°—24°C. Each dot represents the average maximum ΔF/F0 during one trial at a given temperature. Each sample was subjected to a maximum of 3 rounds of cooling. n=14 animals.
