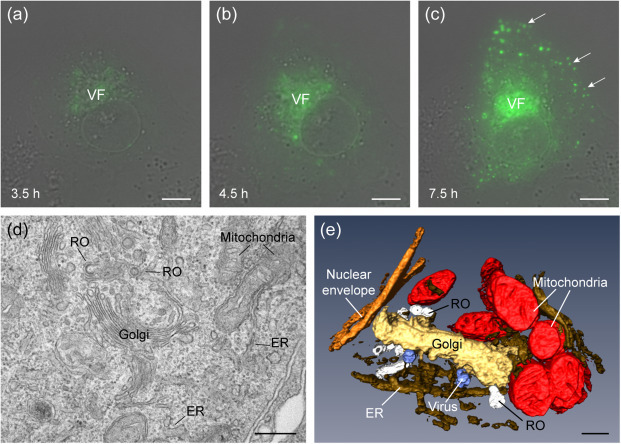
Fig. 2.

Visualization of a viral factory by live cell imaging, 2D TEM and 3D TEM. (a, b, c) Snapshots from a live cell microscopy movie showing the biogenesis and evolution of a bunyavirus factory (VF). BHK-21 cells were infected with the fluorescent bunyavirus eGFP-Gc-BUNV and transferred to a TCS-SP5 microscope (Leica Microsystems). Images were recorded every 15 min from 1 to 18 h post-infection (hpi). (a) Initial stage of factory assembly. (b) The viral factory grows over time with perinuclear localization. (c) Late stage of infection with the large factory and some secretory vesicles (arrows) with viruses at the plasma membrane. (d) Ultrathin section of viral factories observed after conventional embedding and TEM. BHK-21 cells were adsorbed with bunyavirus and fixed at 10 hpi; Golgi stacks and replication organelles (RO) that contain the replication complexes are shown with mitochondria and endoplasmic reticulum (ER) membranes surrounding the factories. (e) Factory as visualized by TEM of serial sections, 3D reconstruction and image processing. Vero cells were adsorbed with bunyavirus for 10 h. The modified Golgi stack (gold) with spherules/ROs (white) and newly formed viral particles (blue) is surrounded by mitochondria (red) and ER (brown), adjacent to the nuclear envelope (orange). Scale bars = 10 µm in (a, b, c); 500 nm in (d); and 200 nm in (e).
