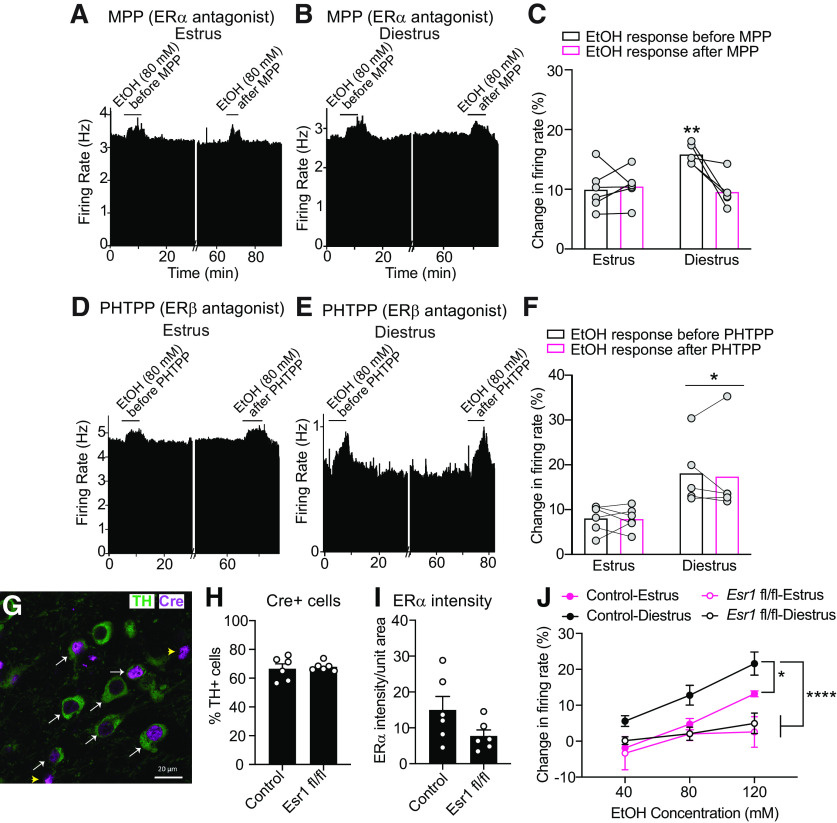
Figure 3.
ERα regulates ethanol sensitivity of VTA neurons from mice in diestrus. A, B, Rate meter graphs represent the response of a representative neuron to 80 mm ethanol (EtOH) before and after treatment with the ERα antagonist MPP from mice in estrus (A) and diestrus (B). C, Graph of neuronal responses to 80 mm EtOH from mice in estrus (n = 5) and diestrus (n = 6) before and after treatment of slices with MPP. The enhanced EtOH-induced excitation of neurons from mice in diestrus was decreased after treatment with MPP, whereas the EtOH responses of VTA neurons from mice in estrus are unchanged by MPP. **p < 0.05, comparing diestrus with estrus before MPP treatment and comparing responses in diestrus before and after MPP by post hoc Sidak's multiple comparisons test. D, E, Rate meter graphs represent the response of a representative neuron to 80 mm EtOH before and after treatment with the ERβ antagonist PHTPP from mice in estrus (D) and diestrus (E). F, Graph of neuronal responses to 80 mm EtOH from mice in estrus (n = 6) and diestrus (n = 5) before and after treatment of slices with PHTPP. There was no change in EtOH excitation after PHTPP treatment, but there was a significant main effect of cycle phase. *p < 0.05, main effect of cycle (two-way ANOVA). G, Representative image showing Cre recombinase expression in TH-expressing neurons in the VTA. Brain sections transduced with AAV9-Th-Cre virus were processed for fluorescent IHC with antibodies to Cre recombinase (magenta) and TH (green). White arrows indicate TH-positive and Cre-positive cells. Yellow arrowheads indicate 2 cells expressing Cre but not TH. Scale bar, 20 μm. H, Graph of % of Cre-expressing cells that also express TH in control and Esr1 fl/fl mice (n = 6 mice, each mouse as the mean of 8 neurons). I, Graph of ERα immunoreactivity in TH-expressing cells in control and Esr1 fl/fl mice (n = 6 mice, each mouse as the mean of 8 neurons). J, Graph of neuronal responses to EtOH (40, 80, and 120 mm) in control mice and Esr1 fl/fl mice in estrus and diestrus. *p < 0.05; ****p < 0.0001; Tukey's test after two-way repeated-measures ANOVA.

