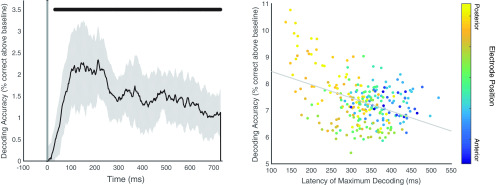
Figure 5.
Left, Decoding performance relative to the false-positive rate observed during the baseline windows. Top line indicates decoding performance that is significantly over the false positive rate. Shaded area represents 95% CI. Right, Latency of maximum decoding performance and maximum decoding accuracy relative to the false-positive rate. Each point represents an electrode, averaged across participants. Color represents cap location of electrode from posterior to anterior. Gray line indicates the regression line.

