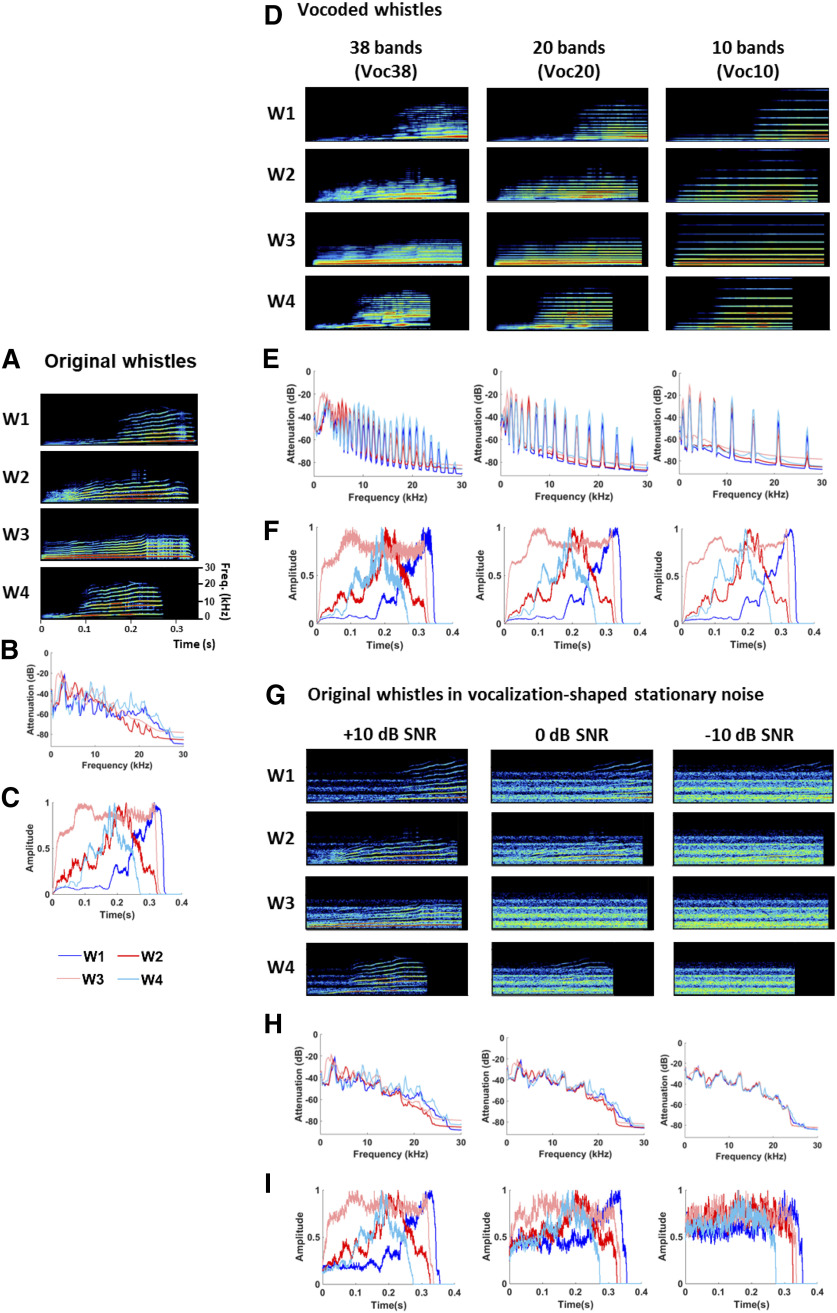
Figure 1.
Spectrograms, spectra, and temporal envelopes of the acoustic stimuli. A–C, Spectrograms (A), spectra (B), and temporal envelopes (C) of the four original whistles used in this study. D–F, From left to right: spectrograms (D), spectra (E), and temporal envelopes (F) of the four vocoded whistles using 38, 20, and 10 frequency bands. G–I, From left to right: spectrograms (G), spectra (H), and temporal envelopes (I) of the four original whistles embedded in a vocalization-shaped stationary noise at three SNRs (+10, 0, and −10 dB).

